Adtheorent SPAC Presentation Deck
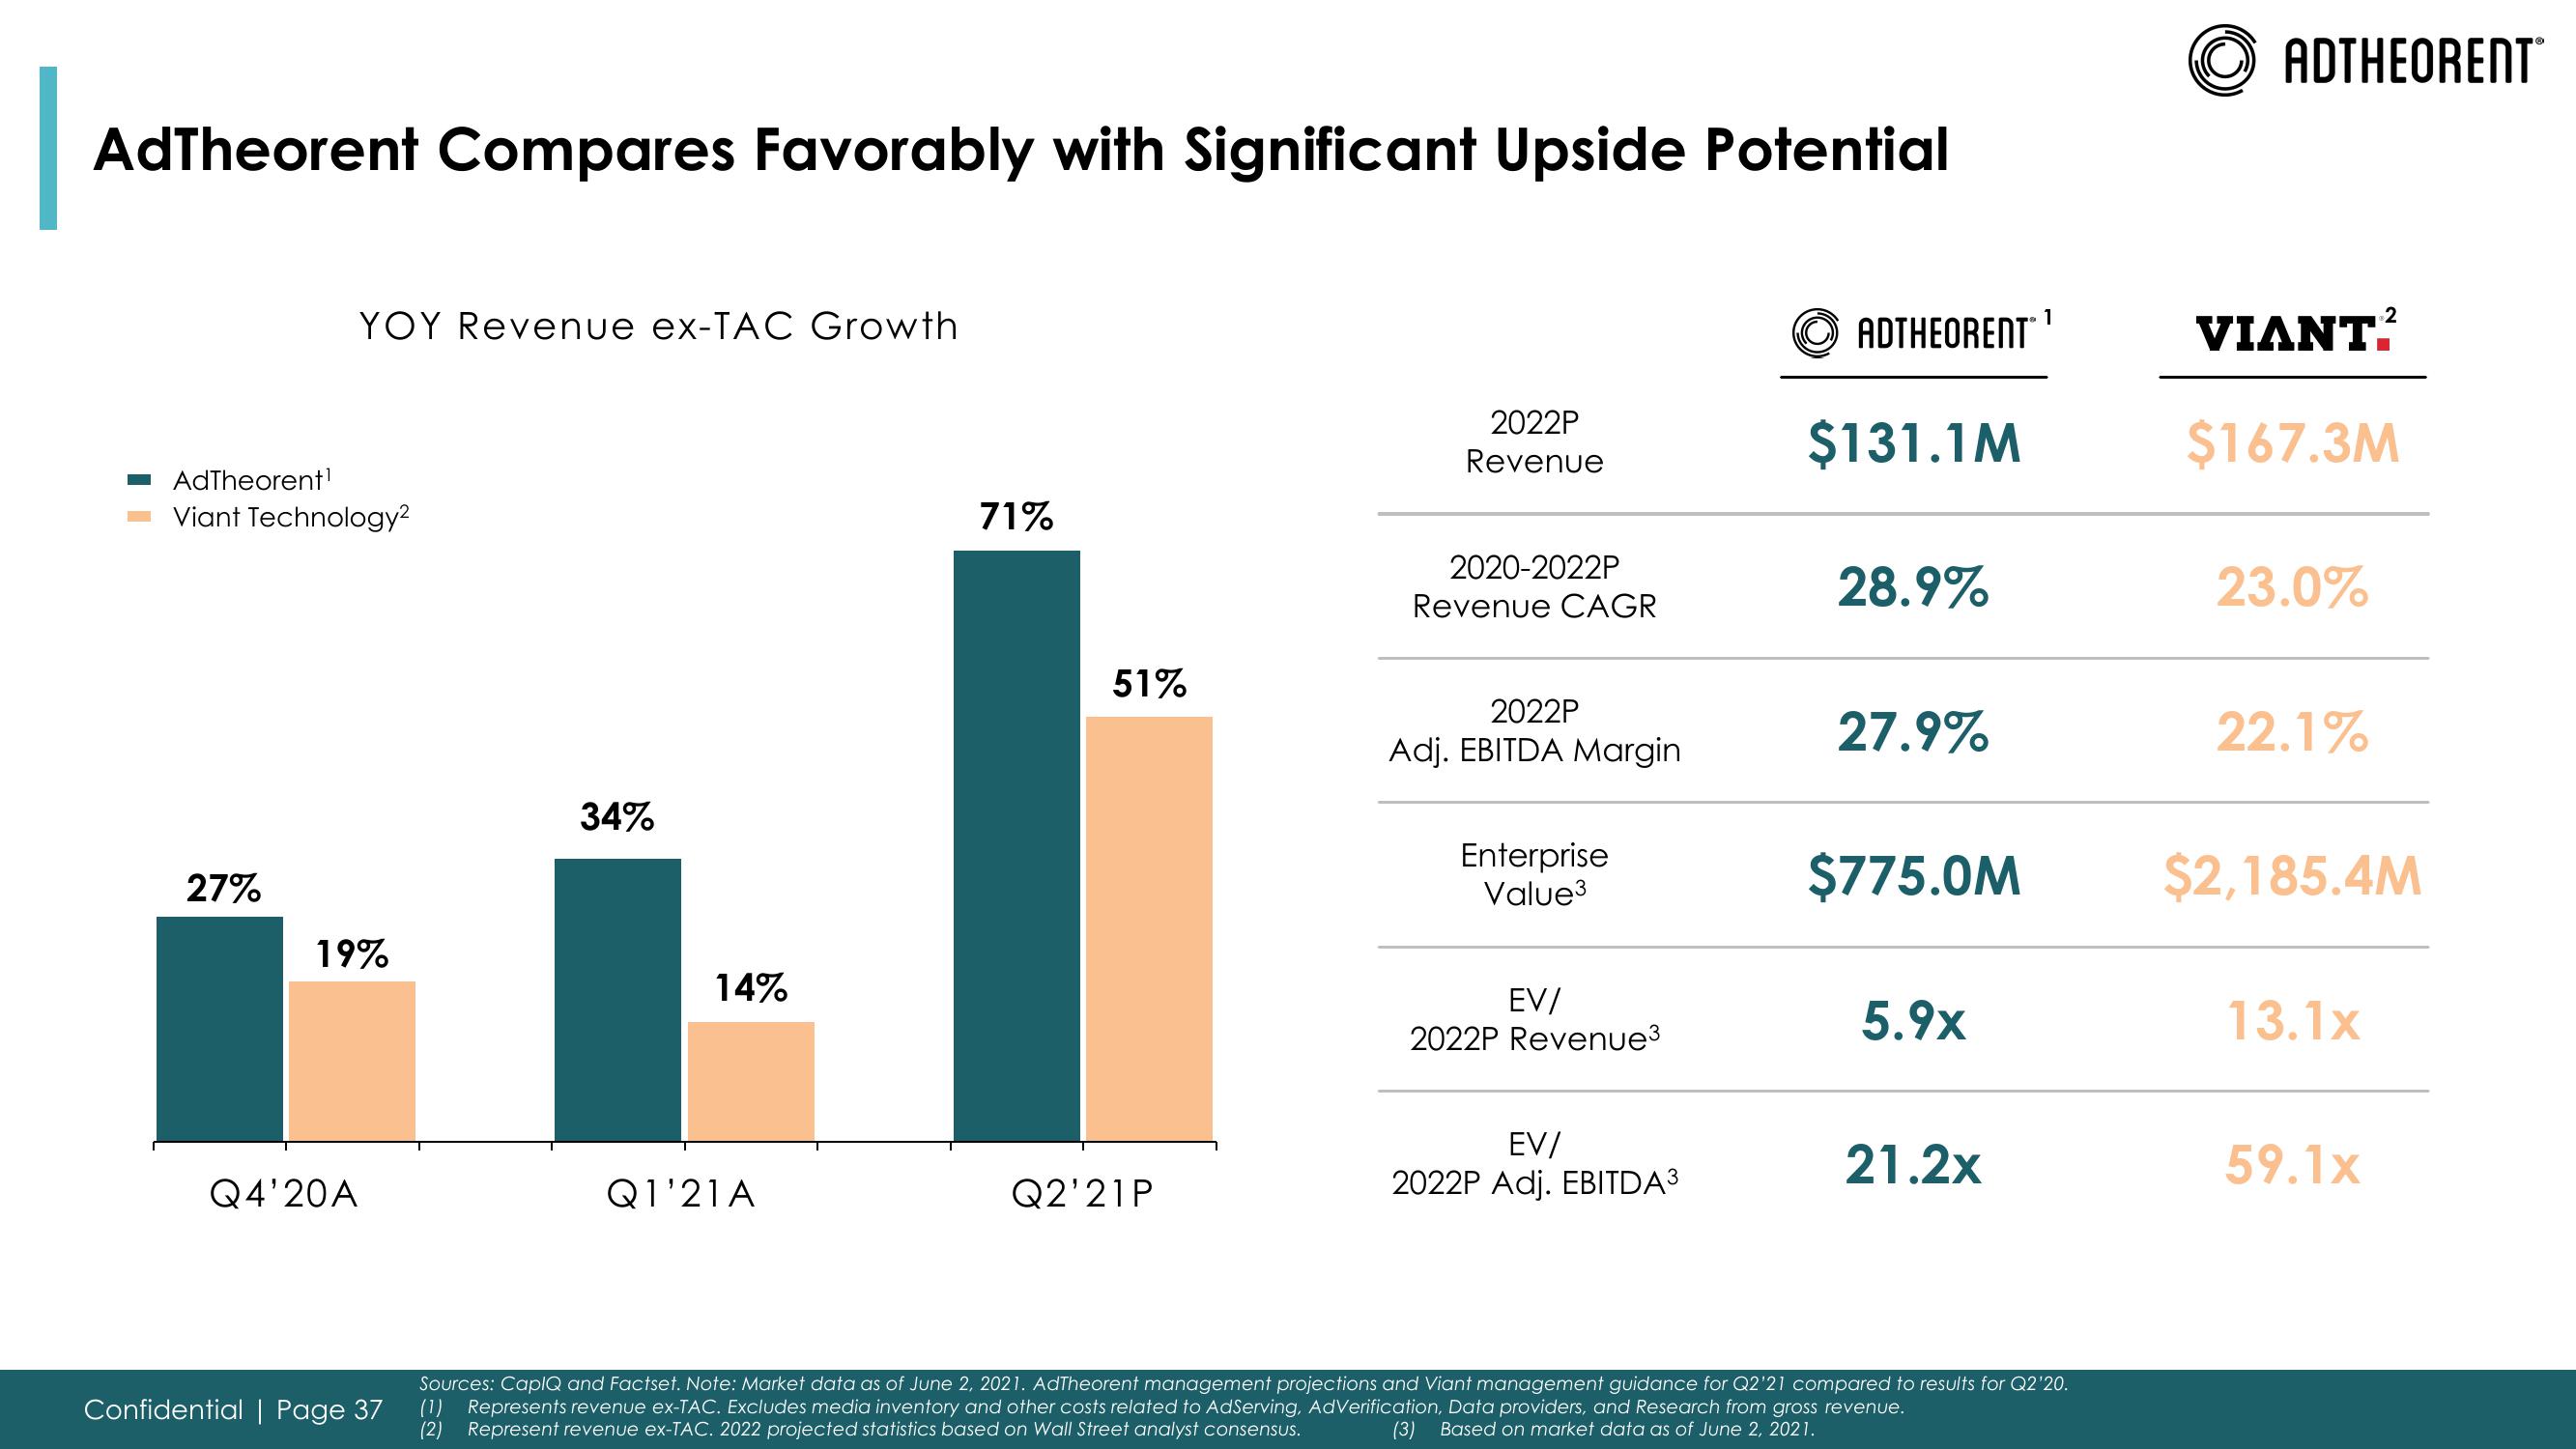
AdTheorent Compares Favorably with Significant Upside Potential
YOY Revenue ex-TAC Growth
AdTheorent¹
Viant Technology²
27%
19%
Q4'20A
Confidential | Page 37
34%
14%
Q1'21A
71%
51%
Q2'21P
2022P
Revenue
2020-2022P
Revenue CAGR
2022P
Adj. EBITDA Margin
Enterprise
Value³
EV/
2022P Revenue³
EV/
2022P Adj. EBITDA ³
ADTHEORENT
$131.1M
28.9%
27.9%
$775.0M
5.9x
21.2x
1
Sources: CapIQ and Factset. Note: Market data as of June 2, 2021. AdTheorent management projections and Viant management guidance for Q2'21 compared to results for Q2'20.
(1) Represents revenue ex-TAC. Excludes media inventory and other costs related to AdServing, AdVerification, Data providers, and Research from gross revenue.
(2) Represent revenue ex-TAC. 2022 projected statistics based on Wall Street analyst consensus.
(3) Based on market data as of June 2, 2021.
ADTHEORENT
VIANT.
$167.3M
23.0%
22.1%
$2,185.4M
13.1x
59.1xView entire presentation