AstraZeneca Results Presentation Deck
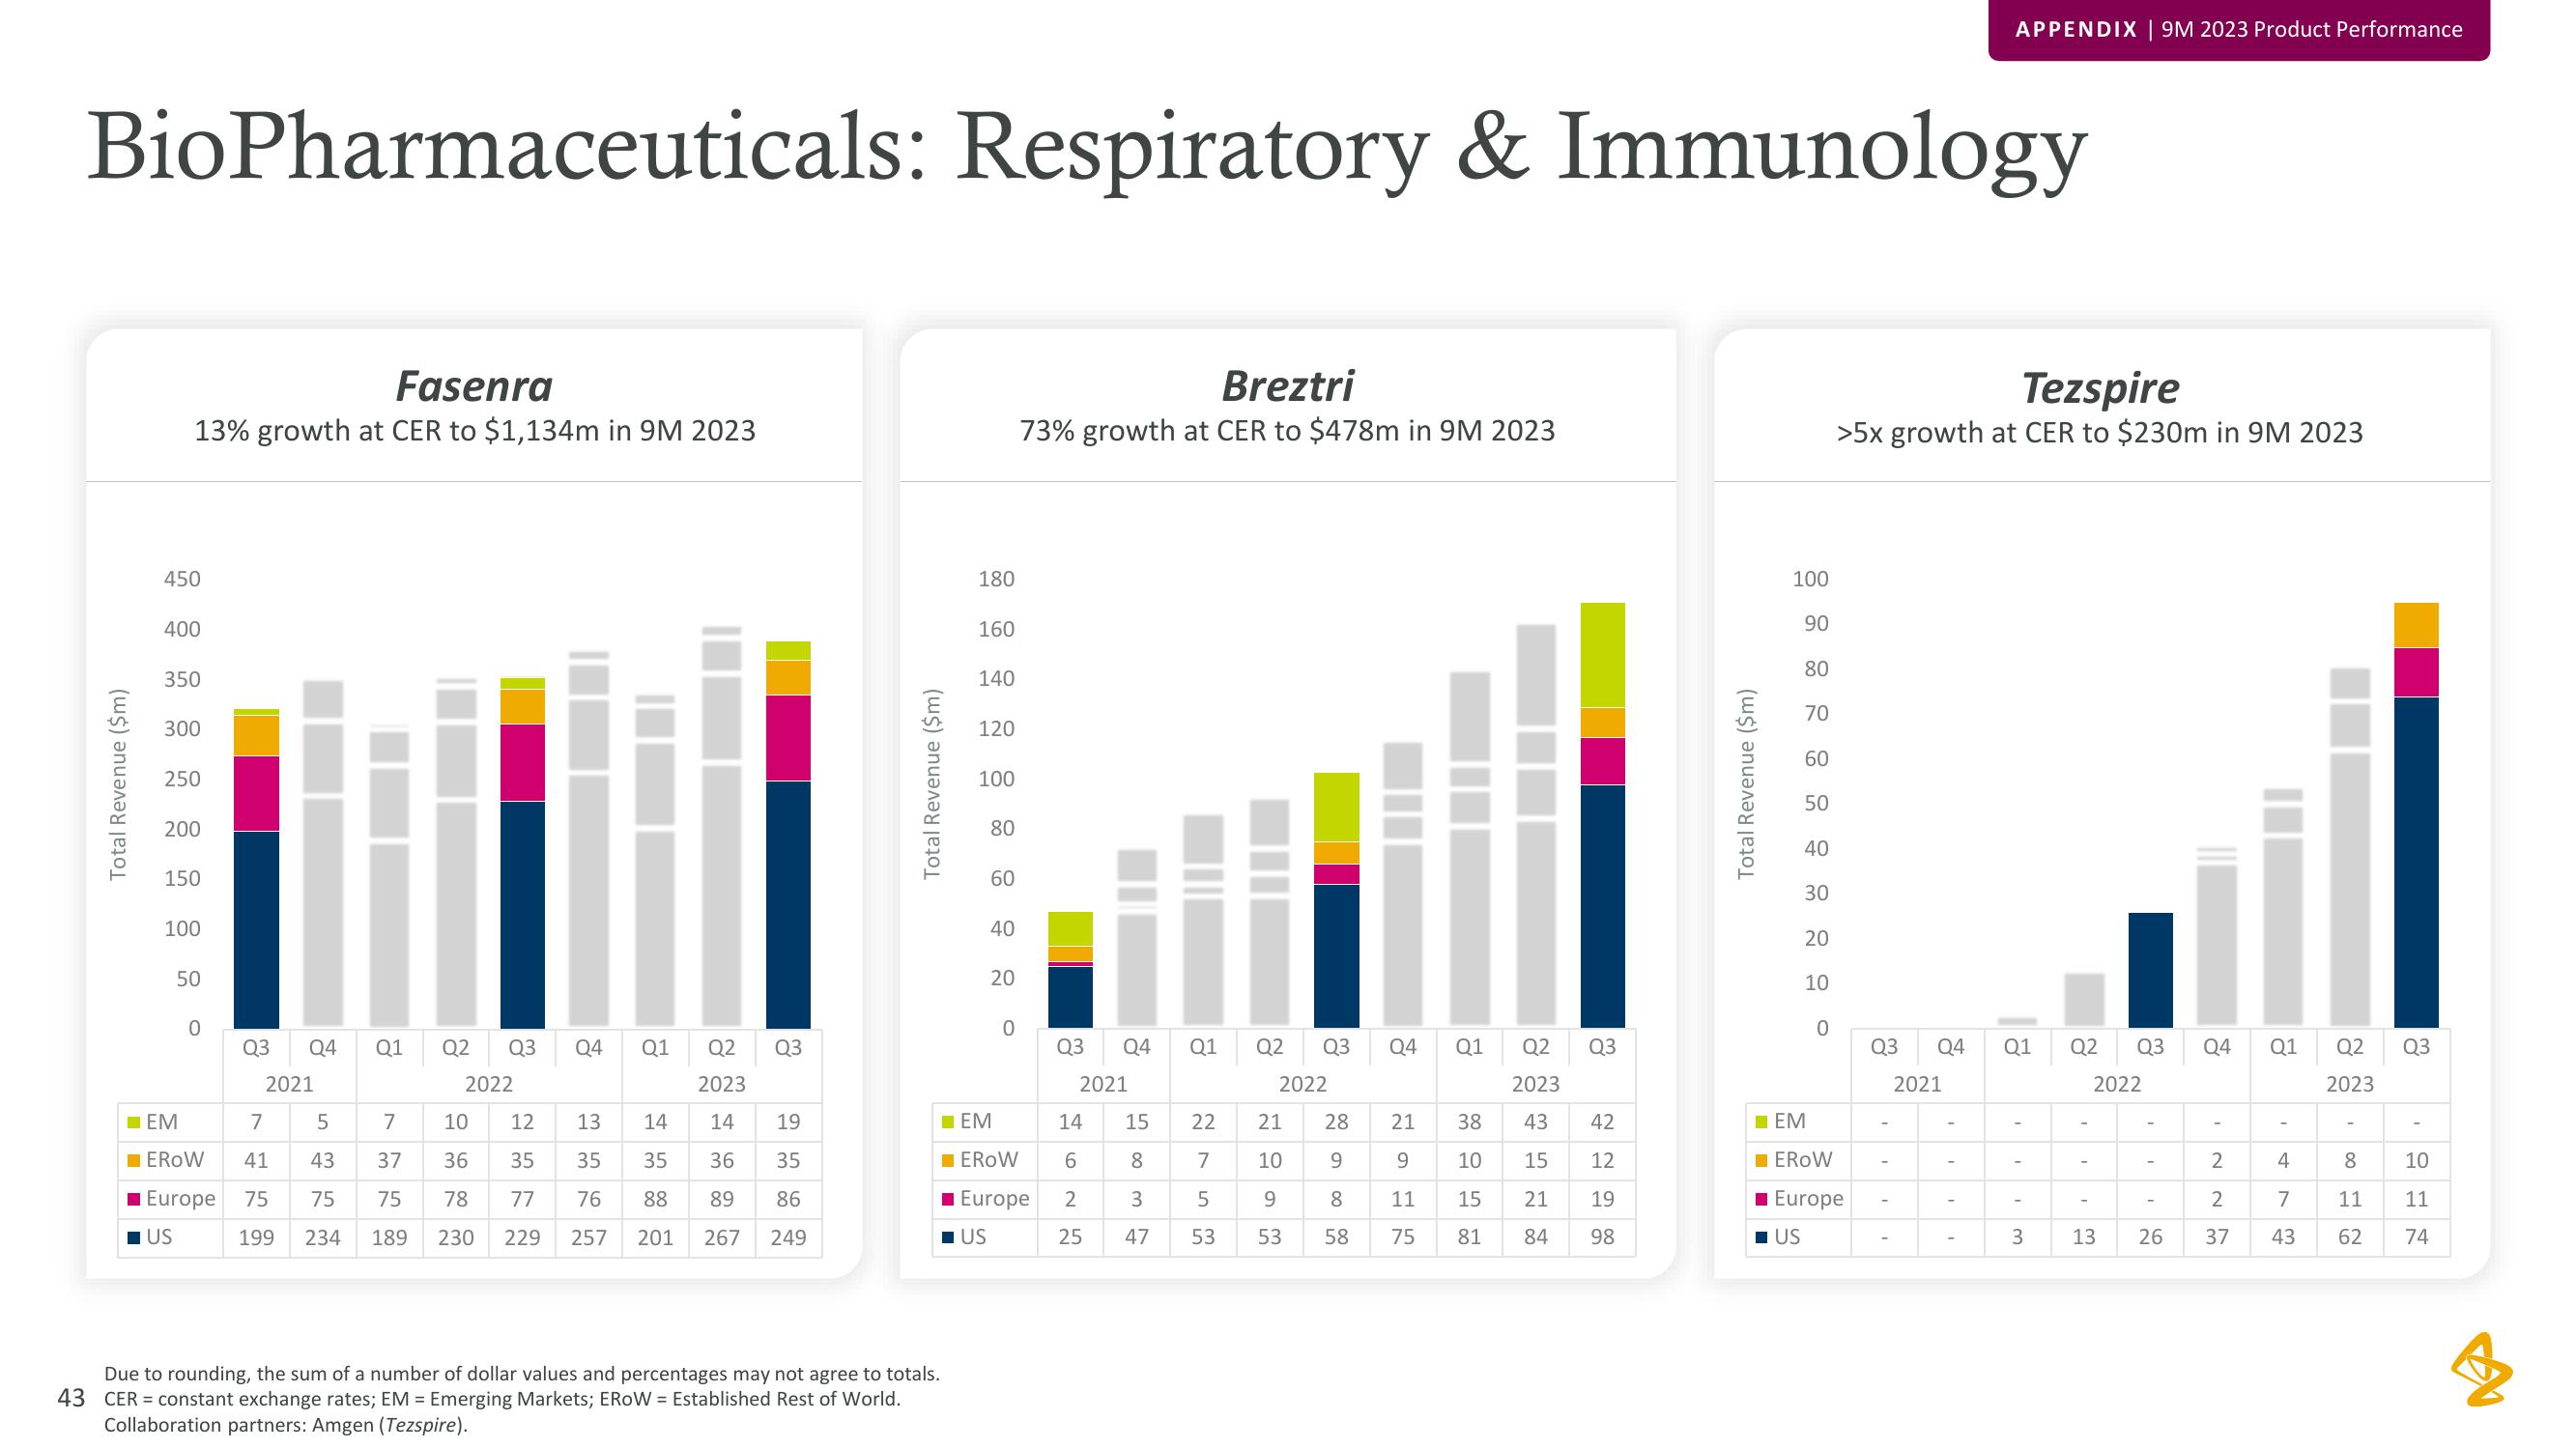
BioPharmaceuticals: Respiratory & Immunology
Total Revenue ($m)
Fasenra
13% growth at CER to $1,134m in 9M 2023
450
400
350
300
250
200
150
100
50
■EM
Q3
Q4 Q1
2021
7
7
5
41 43
37
75 75
199 234 189
EROW
Europe 75
US
Q2
2023
10
12
13
14
14
19
36
35
35
35 36
35
78 77
76 88 89
86
230 229 257 201 267 249
Q2
Q3 Q4
Q1
2022
Q3
180
160
Due to rounding, the sum of a number of dollar values and percentages may not agree to totals.
43 CER = constant exchange rates; EM = Emerging Markets; EROW= Established Rest of World.
Collaboration partners: Amgen (Tezspire).
140
120
100
■ EM
80
60
40
20
0
Breztri
73% growth at CER to $478m in 9M 2023
EROW
■ Europe
■ US
Q3
Q4
2021
14
6
2
25
15
8
3
47
Q1
22
7
5
53
Q2
Q3 Q4 Q1 Q2 Q3
2023
2022
21
10
9
53
28
9
8
58
21
9
11
75
38
43 42
10
15
12
15
21
19
81 84
98
100
90
80
70
60
50
40
30
20
10
0
☐EM
Tezspire
>5x growth at CER to $230m in 9M 2023
EROW
■ Europe
■US
Q3
APPENDIX | 9M 2023 Product Performance
Q4 Q1
2021
"
1
!
Q2
Q3 Q4 Q1 Q2 Q3
2023
2022
3 13
26
2
2
37
4
7
43
8 10
11
11
62
74View entire presentation