Dutch Bros Results Presentation Deck
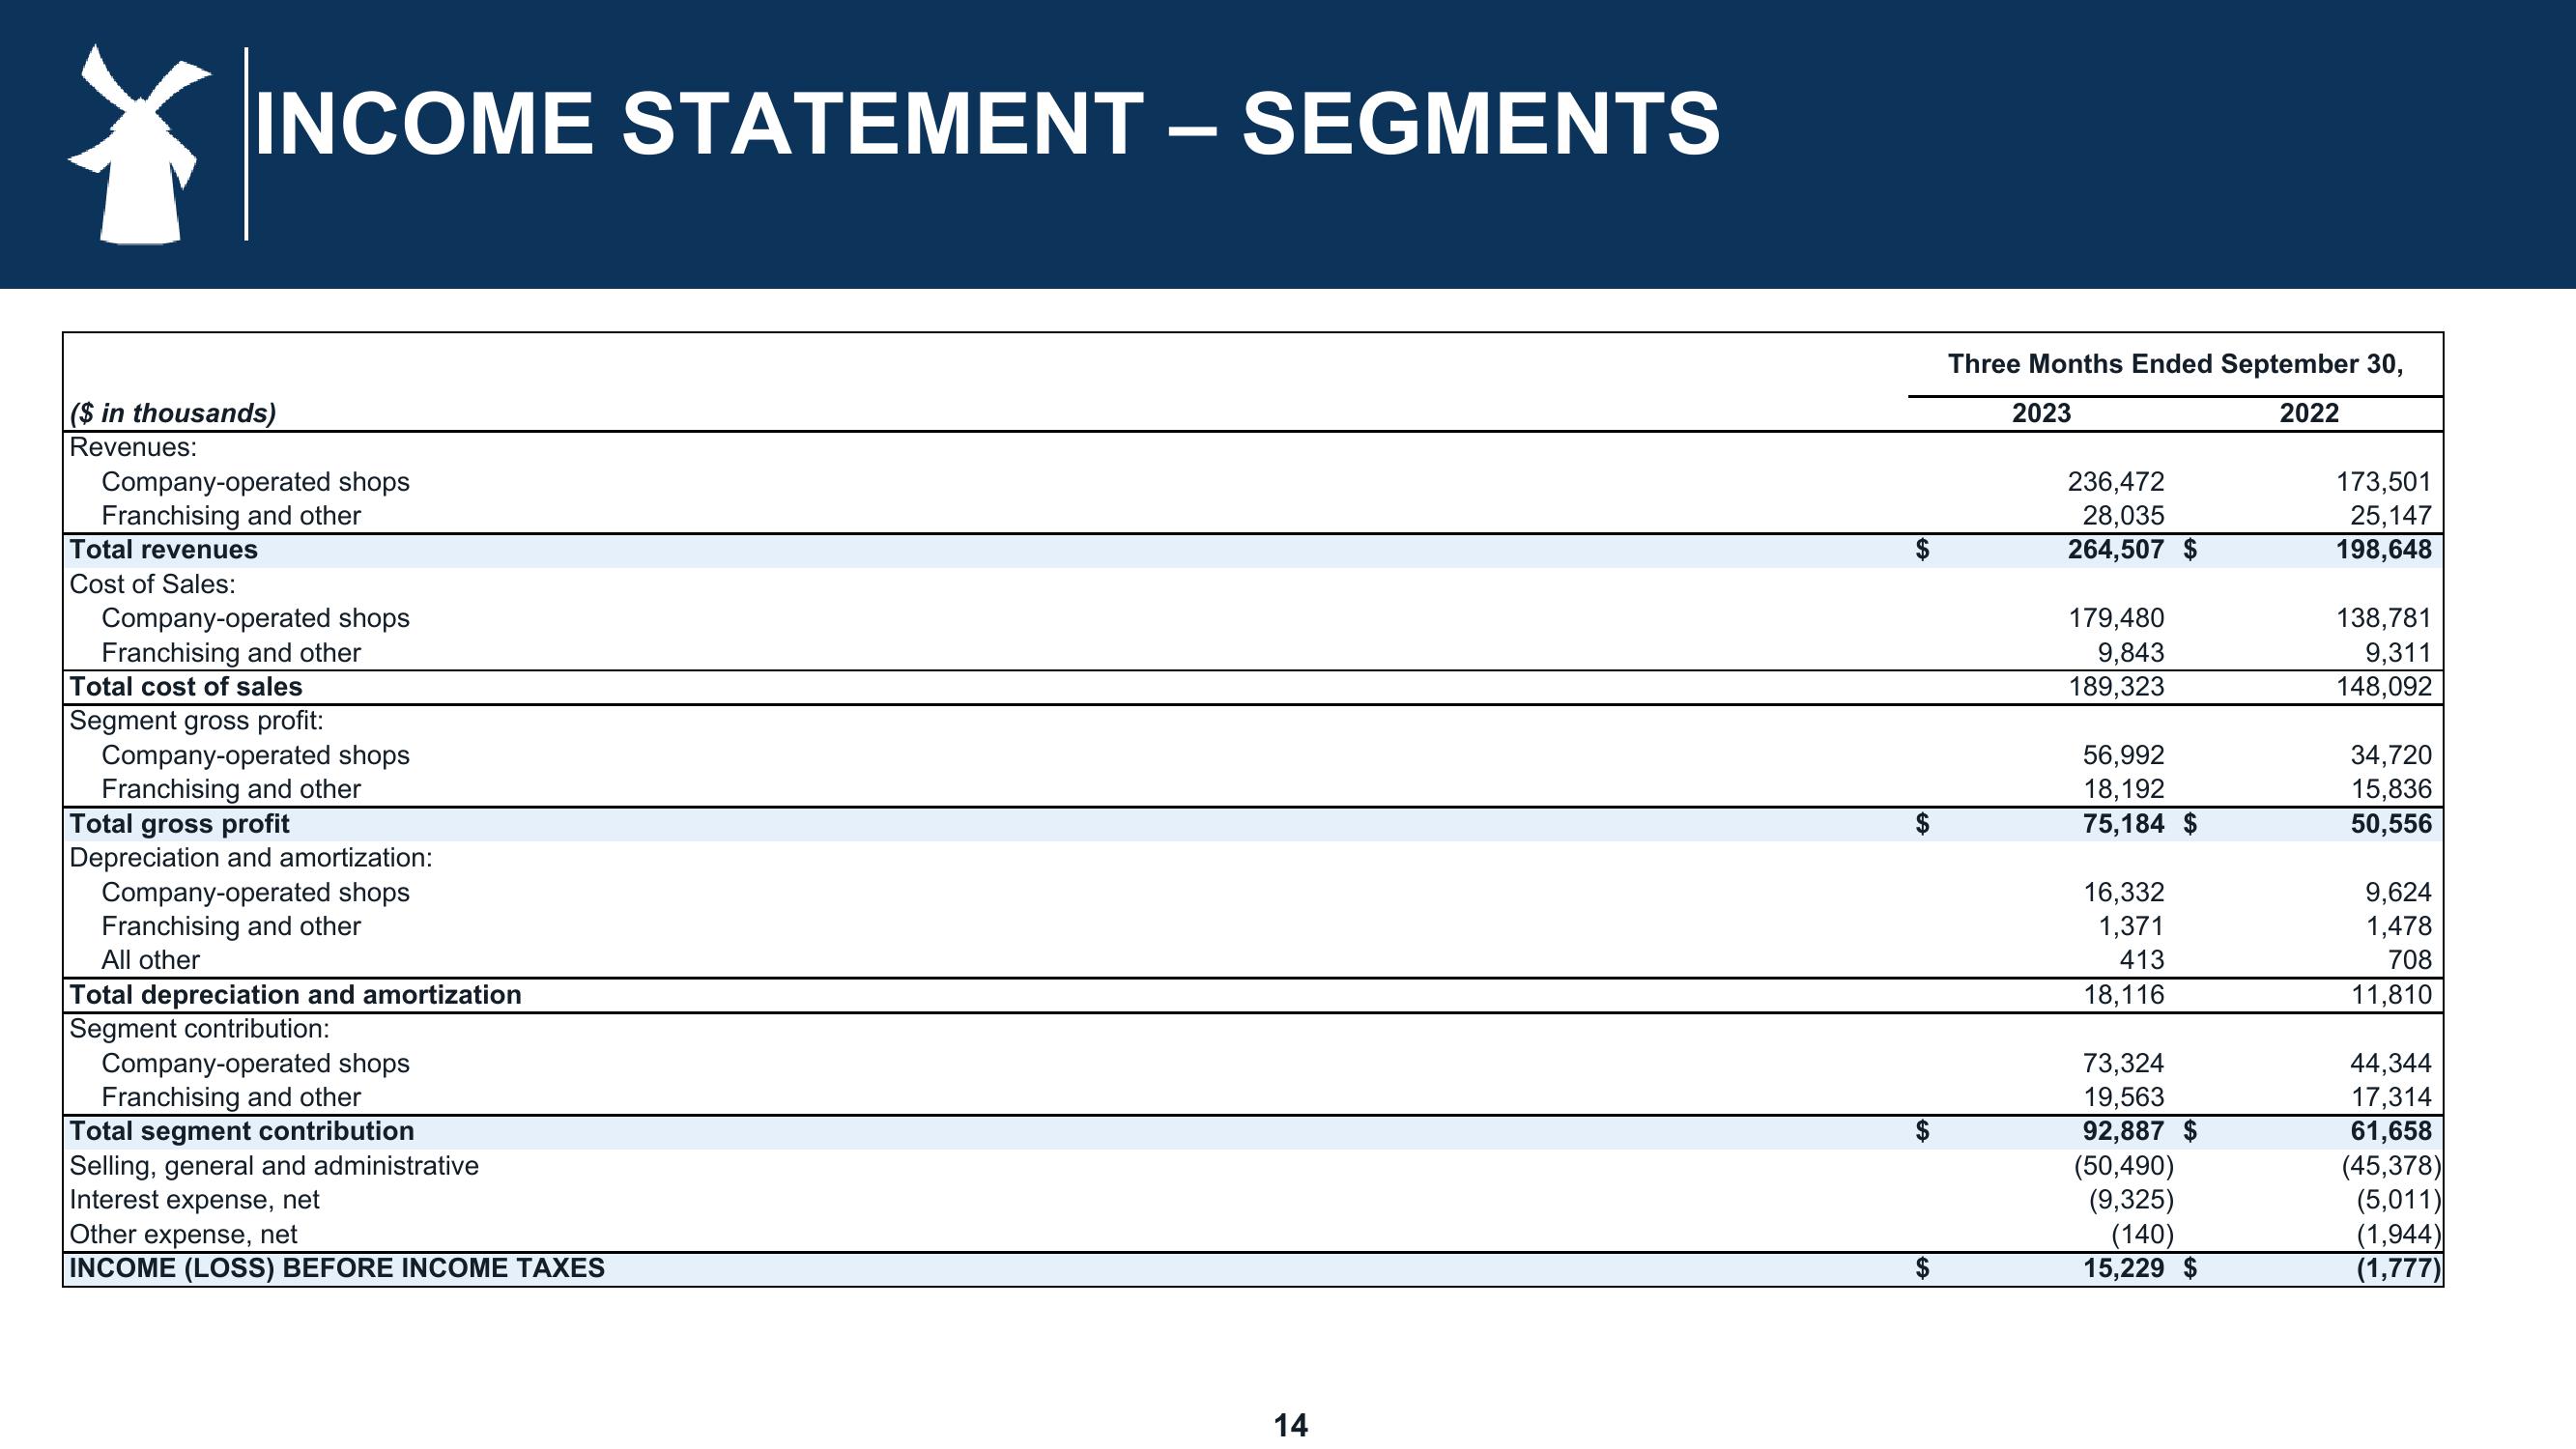
INCOME STATEMENT - SEGMENTS
($ in thousands)
Revenues:
Company-operated shops
Franchising and other
Total revenues
Cost of Sales:
Company-operated shops
Franchising and other
Total cost of sales
Segment gross profit:
Company-operated shops
Franchising and other
Total gross profit
Depreciation and amortization:
Company-operated shops
Franchising and other
All other
Total depreciation and amortization
Segment contribution:
Company-operated shops
Franchising and other
Total segment contribution
Selling, general and administrative
Interest expense, net
Other expense, net
INCOME (LOSS) BEFORE INCOME TAXES
14
Three Months Ended September 30,
2022
2023
236,472
28,035
264,507 $
179,480
9,843
189,323
56,992
18,192
75,184 $
16,332
1,371
413
18,116
73,324
19,563
92,887 $
(50,490)
(9,325)
(140)
15,229 $
173,501
25,147
198,648
138,781
9,311
148,092
34,720
15,836
50,556
9,624
1,478
708
11,810
44,344
17,314
61,658
(45,378)
(5,011)
(1,944)
(1,777)View entire presentation