SoftBank Results Presentation Deck
Consolidated B/S Summary - 3
Equity
Items
Common stock
Capital surplus
Other equity instruments
Retained earnings
Treasury stock
Accumulated other
comprehensive income
Total equity attributable to
owners of the parent
Non-controlling interests
Ratio of equity attributable to
owners of the parent (equity
ratio)
Mar
2023
238.8
2,652.8
10,649.2 11,449.8 +800.5
414.1
2,006.2
-38.8
3,756.8
9,029.8
1,619.4
Jun
2023
20.6%
238.8
2,655.3
414.1
1,495.4 1
-33.3
9,785.5
(\B)
Change
1,664.3
21.4%
+2.5
5,015.2 2+1,258.4
-510.9
+5.5
+755.6
+44.9
+0.9%
= SoftBank
Group
(\ B)
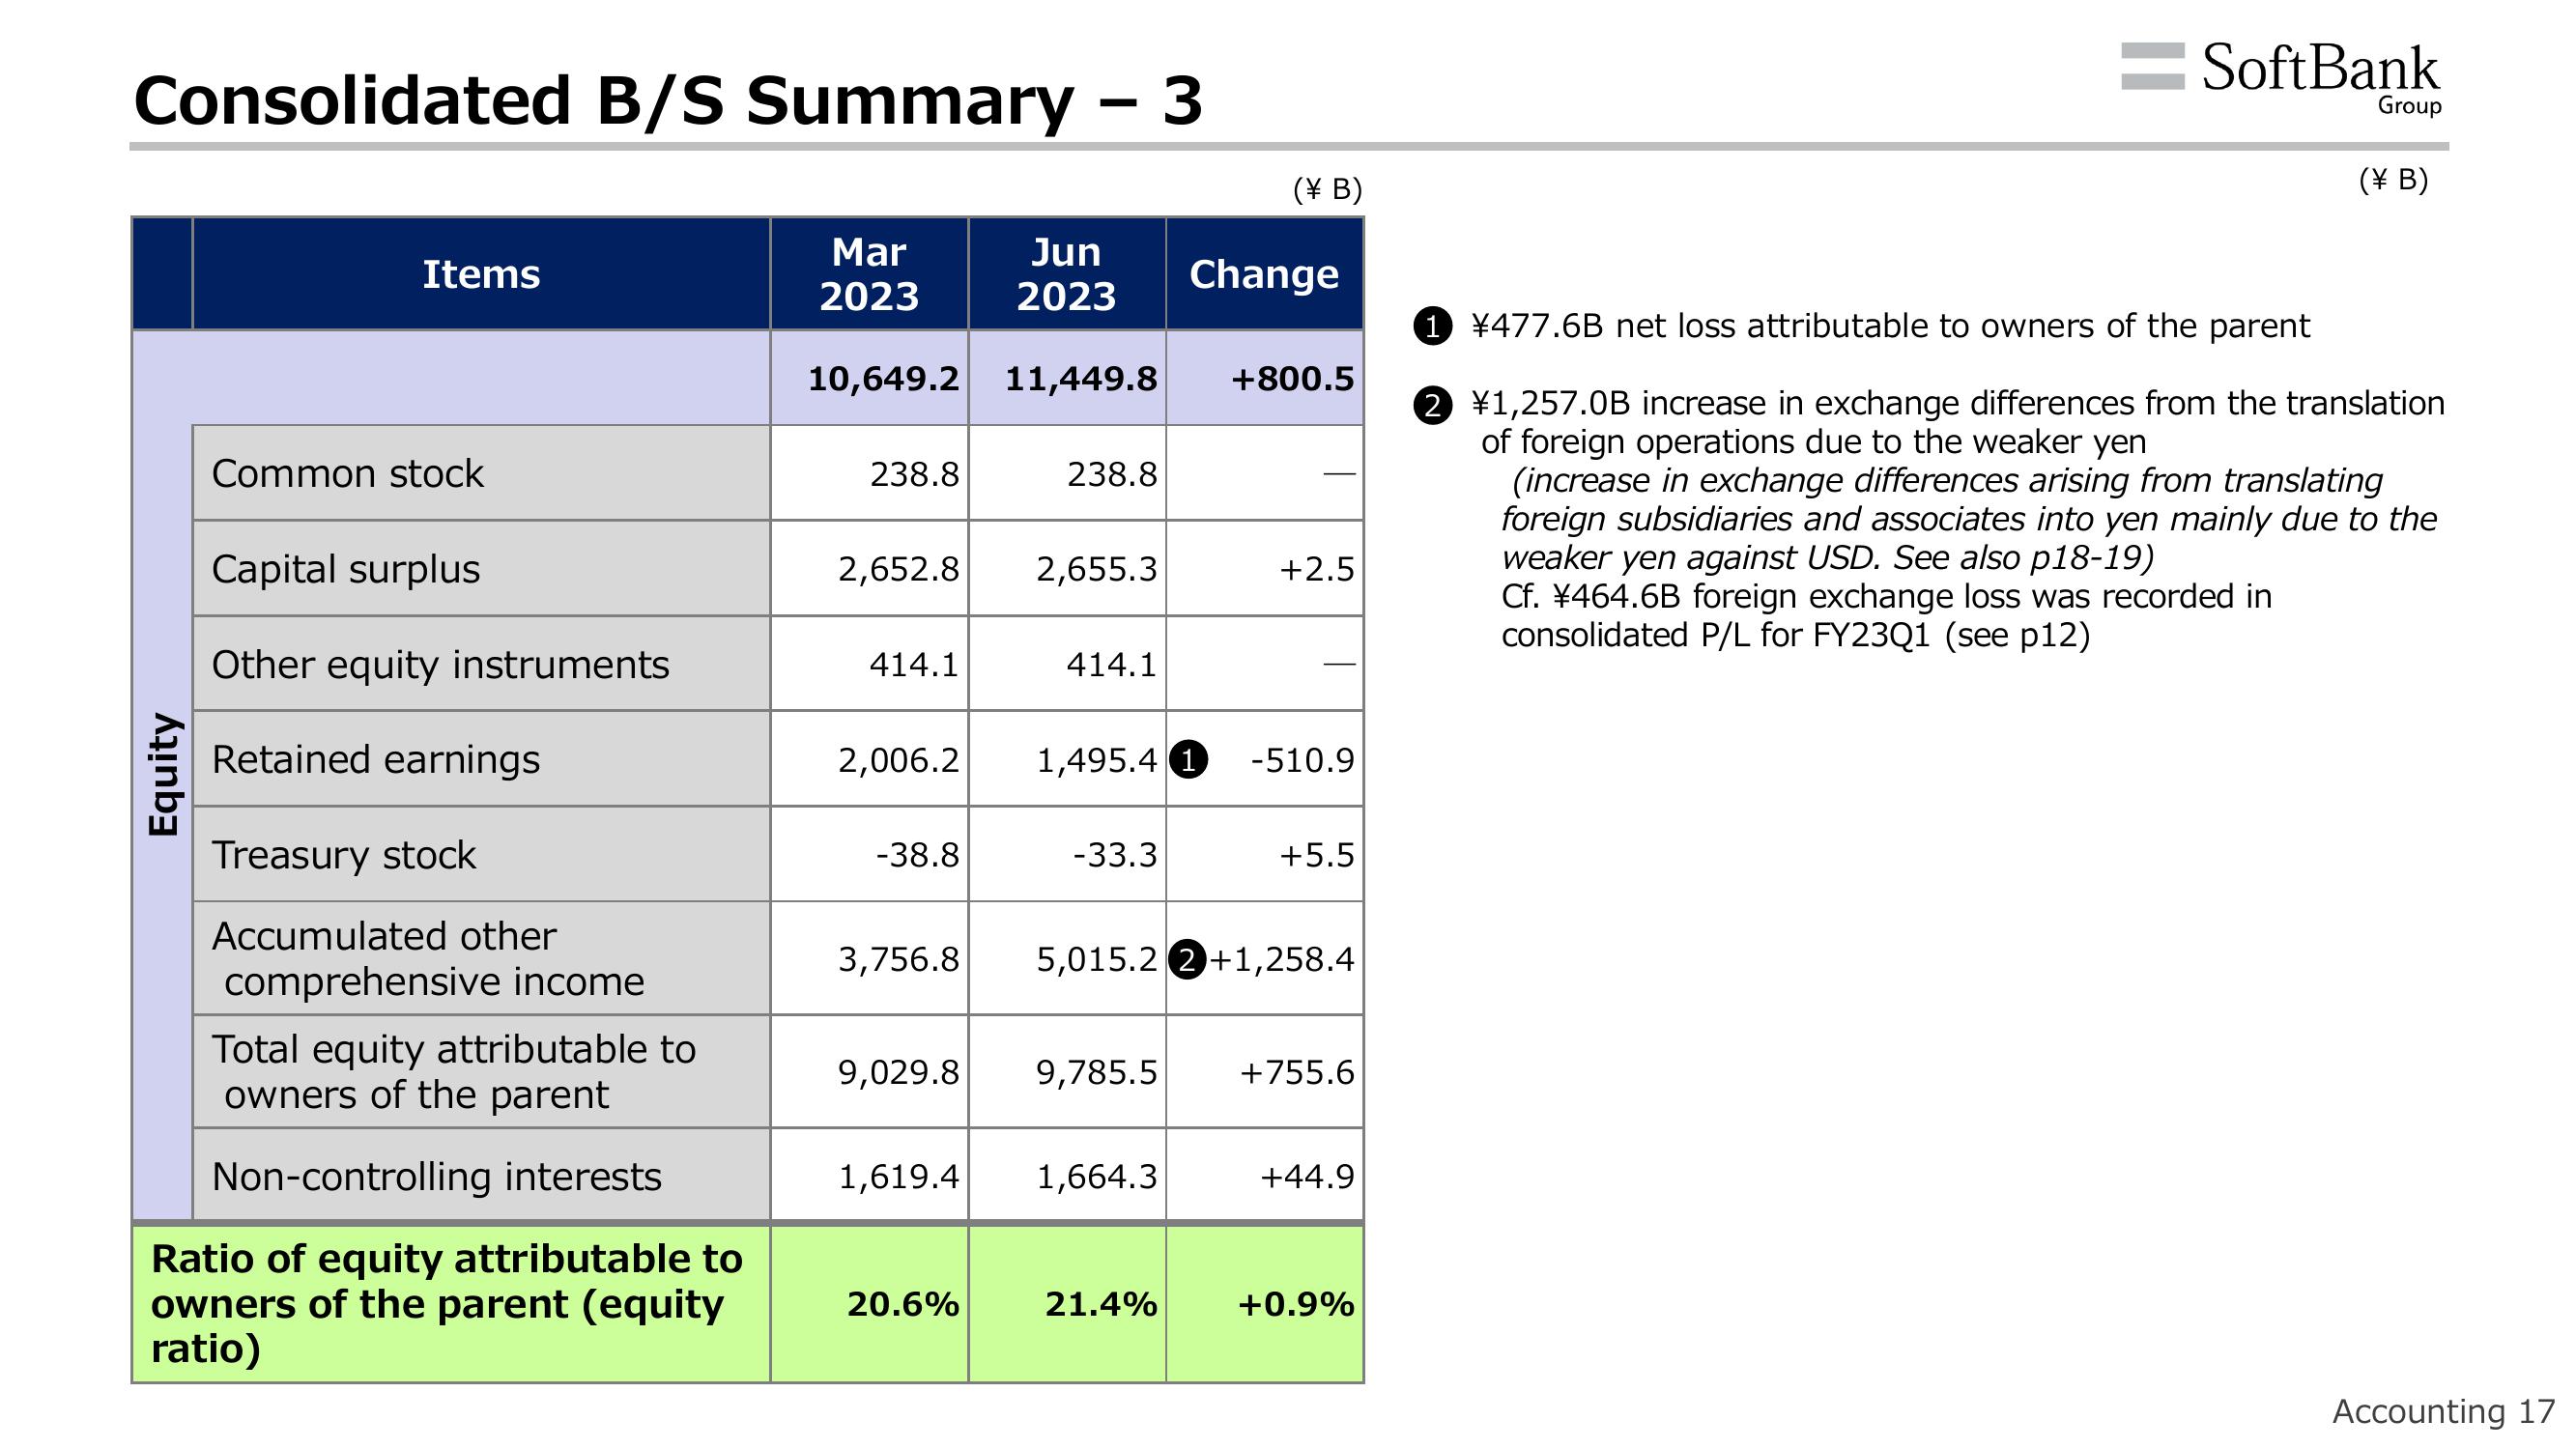
1 ¥477.6B net loss attributable to owners of the parent
2 ¥1,257.0B increase in exchange differences from the translation
of foreign operations due to the weaker yen
(increase in exchange differences arising from translating
foreign subsidiaries and associates into yen mainly due to the
weaker yen against USD. See also p18-19)
Cf. ¥464.6B foreign exchange loss was recorded in
consolidated P/L for FY23Q1 (see p12)
Accounting 17View entire presentation