First Busey Results Presentation Deck
1.
2.
4Q23 Earnings Investor Presentation
Non-GAAP Financial Information
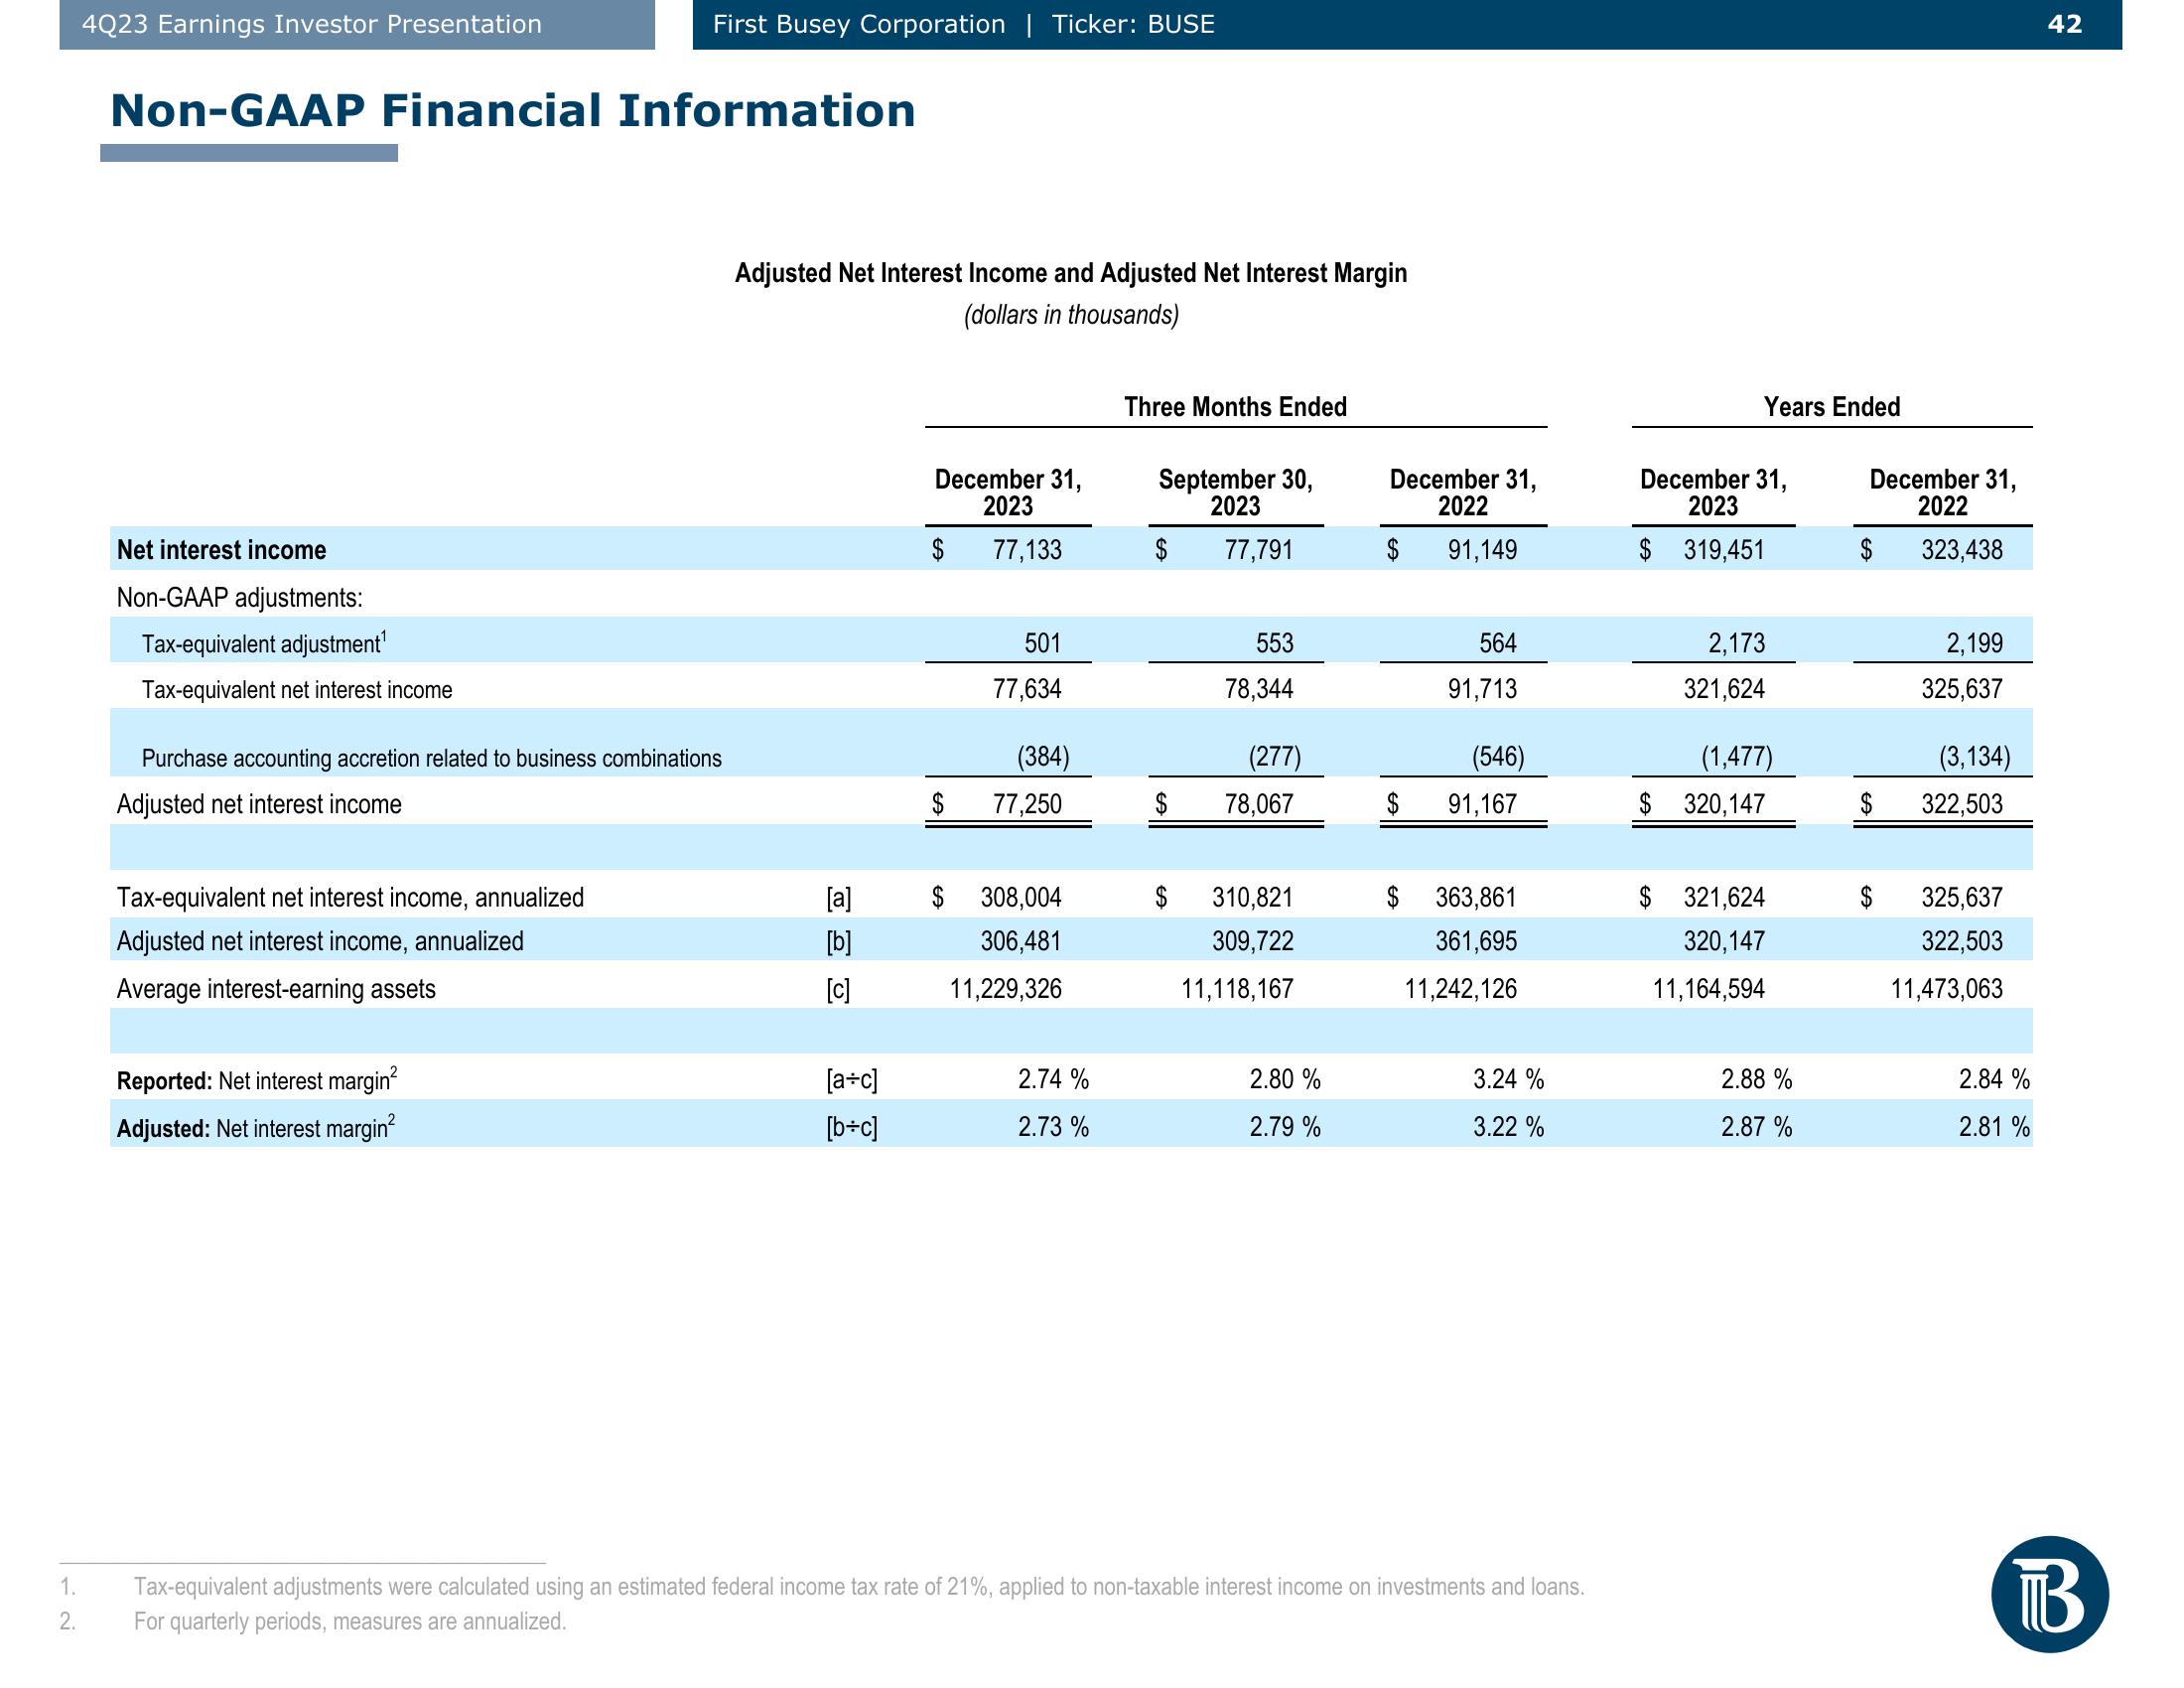
Net interest income
Non-GAAP adjustments:
Tax-equivalent adjustment¹
Tax-equivalent net interest income
First Busey Corporation | Ticker: BUSE
Purchase accounting accretion related to business combinations
Adjusted net interest income
Tax-equivalent net interest income, annualized
Adjusted net interest income, annualized
Average interest-earning assets
Reported: Net interest margin²
Adjusted: Net interest margin²
Adjusted Net Interest Income and Adjusted Net Interest Margin
(dollars in thousands)
[a]
[b]
[0]
[a+c]
[b+c]
December 31,
2023
77,133
$
$
501
77,634
(384)
77,250
308,004
306,481
11,229,326
2.74%
2.73%
Three Months Ended
September 30,
2023
77,791
$
553
78,344
(277)
78,067
310,821
309,722
11,118,167
2.80%
2.79%
December 31,
2022
91,149
$
564
91,713
(546)
$ 91,167
363,861
361,695
11,242,126
3.24 %
3.22%
Tax-equivalent adjustments were calculated using an estimated federal income tax rate of 21%, applied to non-taxable interest income on investments and loans.
For quarterly periods, measures are annualized.
Years Ended
December 31,
2023
$ 319,451
2,173
321,624
(1,477)
$ 320,147
$ 321,624
320,147
11,164,594
2.88 %
2.87 %
December 31,
2022
323,438
$
2,199
325,637
(3,134)
322,503
325,637
322,503
11,473,063
2.84 %
2.81 %
42
BView entire presentation