XP Inc Results Presentation Deck
Non-GAAP Financial Information
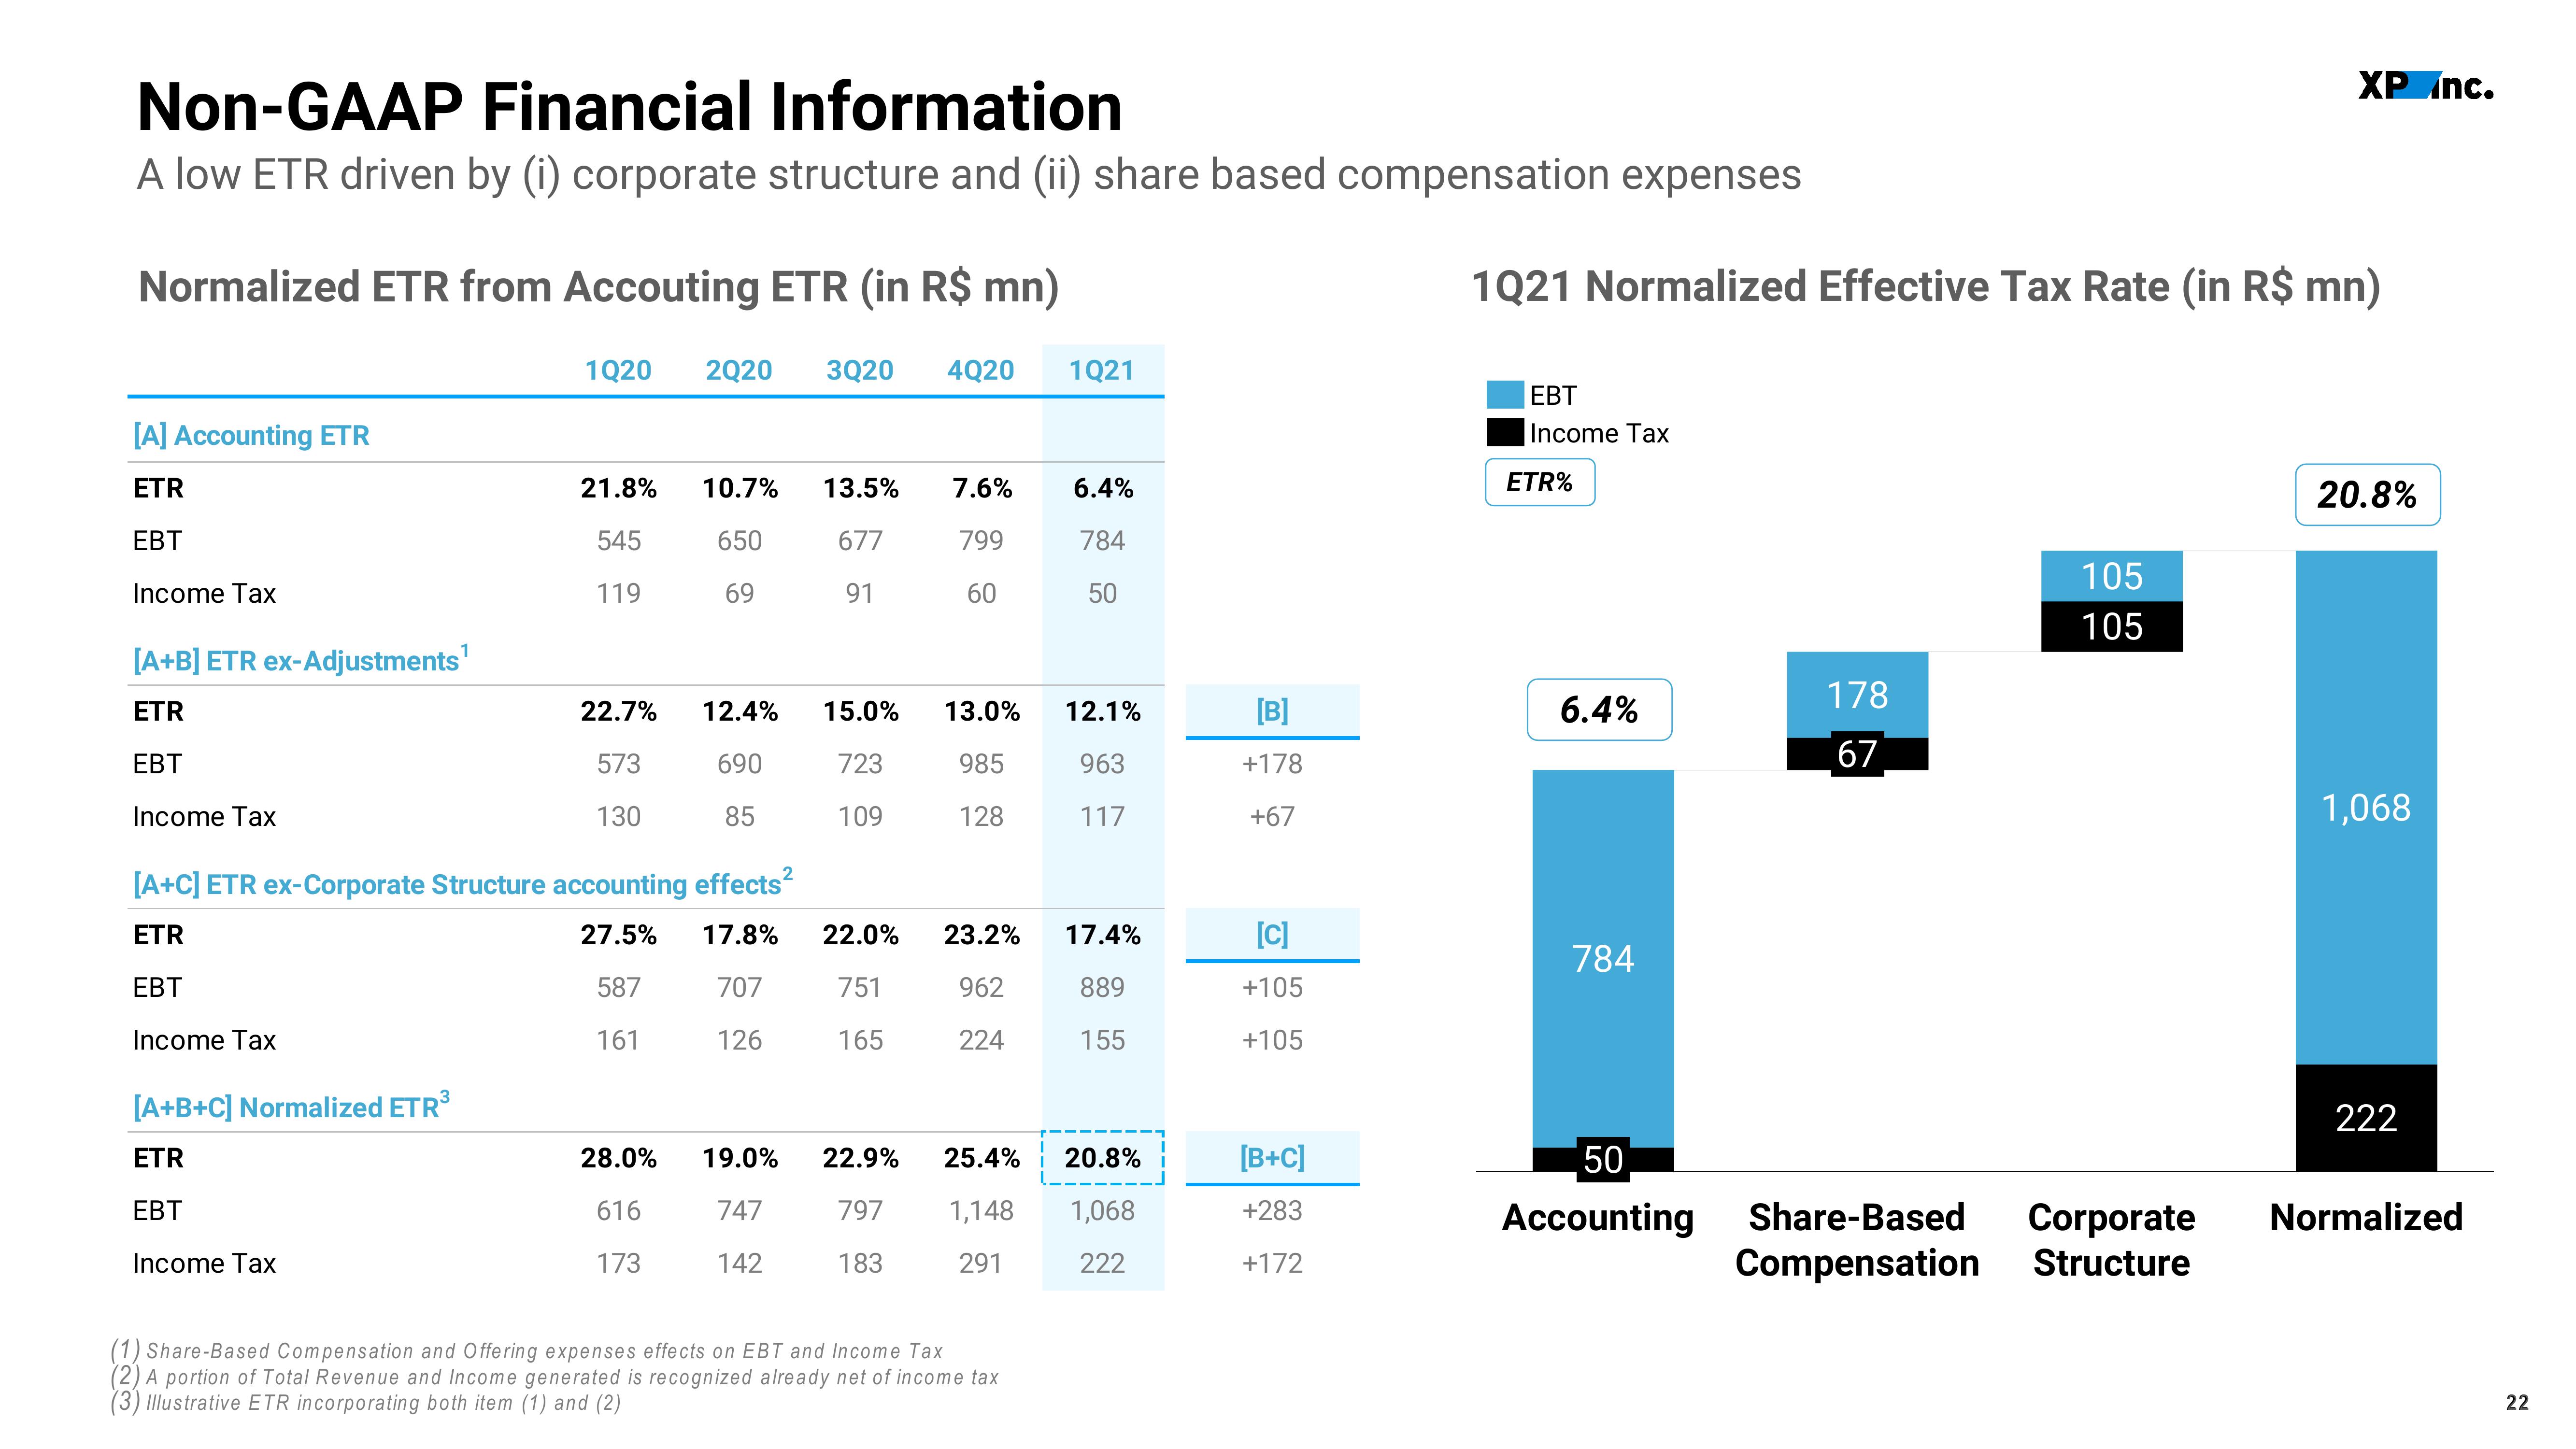
A low ETR driven by (i) corporate structure and (ii) share based compensation expenses
Normalized ETR from Accouting ETR (in R$ mn)
[A] Accounting ETR
ETR
EBT
Income Tax
[A+B] ETR ex-Adjustments¹
ETR
EBT
Income Tax
1Q20
[A+B+C] Normalized ETR³
ETR
EBT
Income Tax
21.8%
545
119
22.7%
573
130
2Q20 3Q20 4Q20 1Q21
28.0%
616
173
10.7%
650
69
2
[A+C] ETR ex-Corporate Structure accounting effects²
ETR
27.5%
EBT
587
Income Tax
161
12.4%
690
85
13.5% 7.6% 6.4%
677
799
784
91
60
50
15.0% 13.0% 12.1%
723
985
963
109
128
117
17.8% 22.0% 23.2% 17.4%
707
751
962
889
126
165
224
155
19.0% 22.9%
747
797
142
183
20.8%
25.4%
1,148 1,068
291
222
(1) Share-Based Compensation and Offering expenses effects on EBT and Income Tax
(2) A portion of Total Revenue and Income generated is recognized already net of income tax
(3) Illustrative ETR incorporating both item (1) and (2)
[B]
+178
+67
[C]
+105
+105
[B+C]
+283
+172
1Q21 Normalized Effective Tax Rate (in R$ mn)
EBT
Income Tax
ETR%
6.4%
784
178
67
105
105
XP nc.
50
Accounting Share-Based Corporate
Compensation Structure
20.8%
1,068
222
Normalized
22View entire presentation