Vivid Seats SPAC Presentation Deck
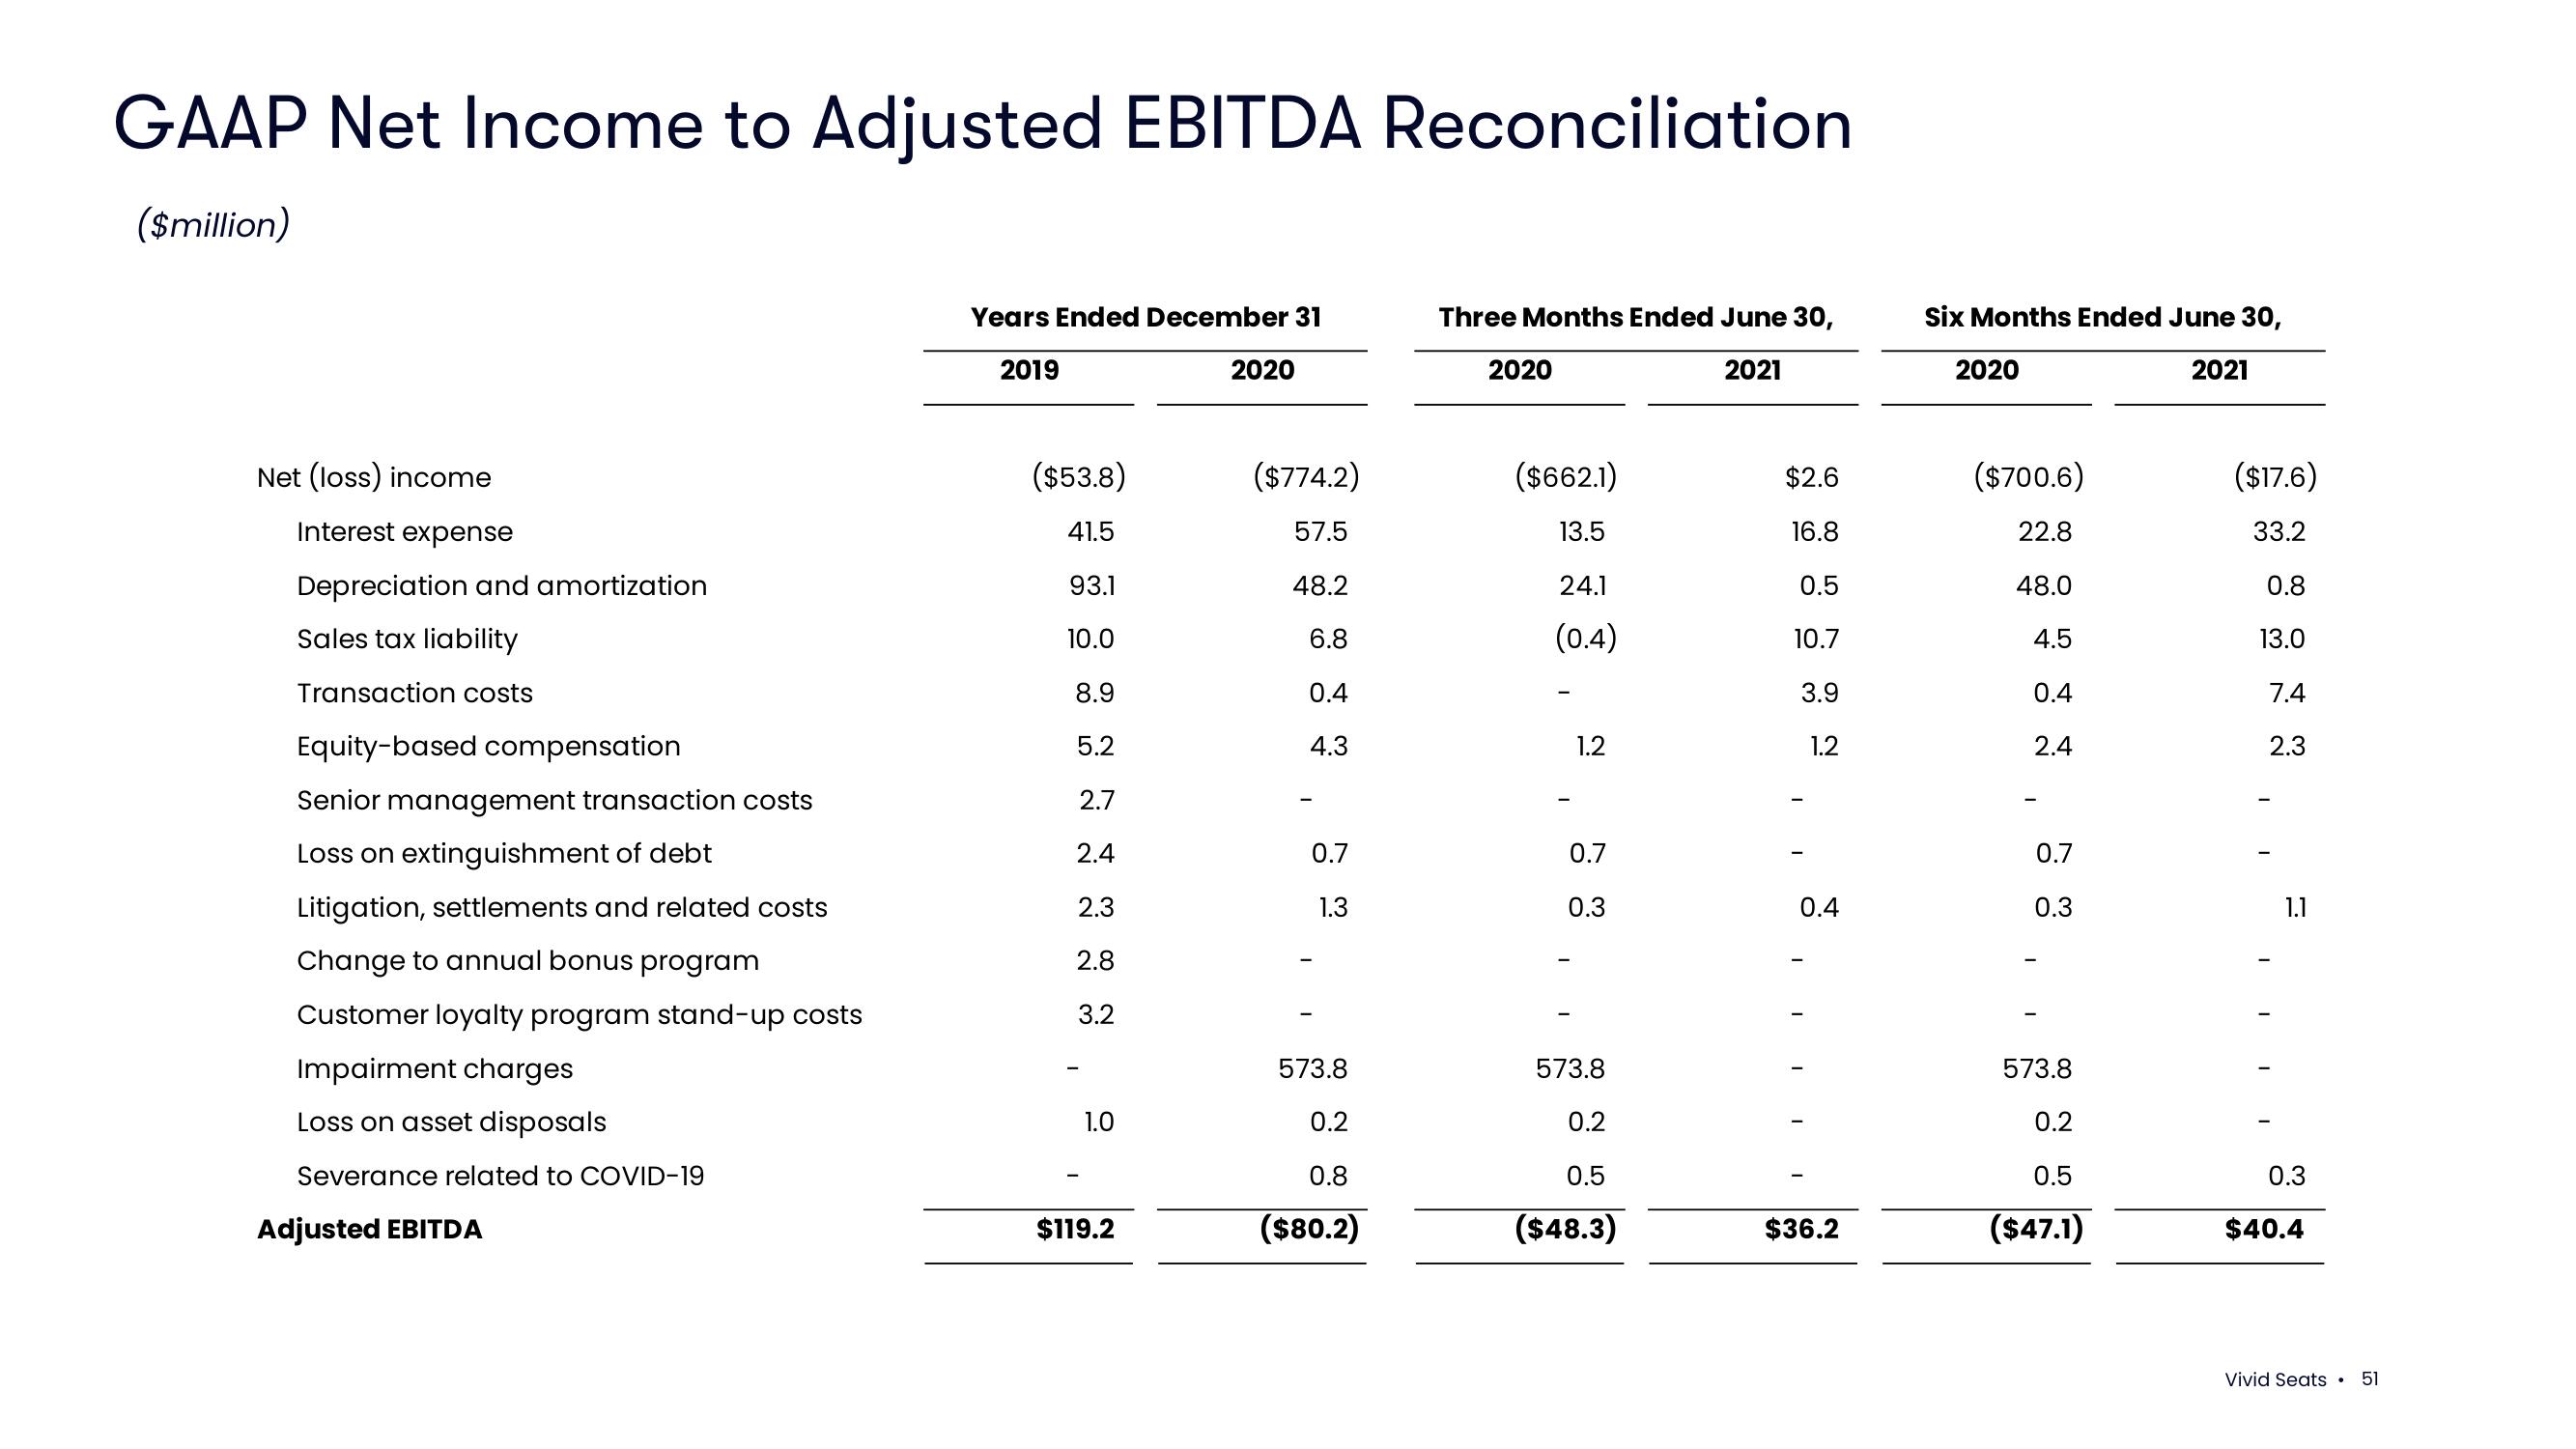
GAAP Net Income to Adjusted EBITDA Reconciliation
($million)
Net (loss) income
Interest expense
Depreciation and amortization
Sales tax liability
Transaction costs
Equity-based compensation
Senior management transaction costs
Loss on extinguishment of debt
Litigation, settlements and related costs
Change to annual bonus program
Customer loyalty program stand-up costs
Impairment charges
Loss on asset disposals
Severance related to COVID-19
Adjusted EBITDA
Years Ended December 31
2019
($53.8)
41.5
93.1
10.0
8.9
5.2
2.7
2.4
2.3
2.8
3.2
1.0
$119.2
2020
($774.2)
57.5
48.2
6.8
0.4
4.3
0.7
1.3
573.8
0.2
0.8
($80.2)
Three Months Ended June 30,
2021
2020
($662.1)
13.5
24.1
(0.4)
I
1.2
0.7
0.3
573.8
0.2
0.5
($48.3)
$2.6
16.8
0.5
10.7
3.9
1.2
0.4
$36.2
Six Months Ended June 30,
2021
2020
($700.6)
22.8
48.0
4.5
0.4
2.4
0.7
0.3
I
573.8
0.2
0.5
($47.1)
($17.6)
33.2
0.8
13.0
7.4
2.3
1.1
0.3
$40.4
Vivid Seats . 51View entire presentation