Commercial Metals Company Investor Presentation Deck
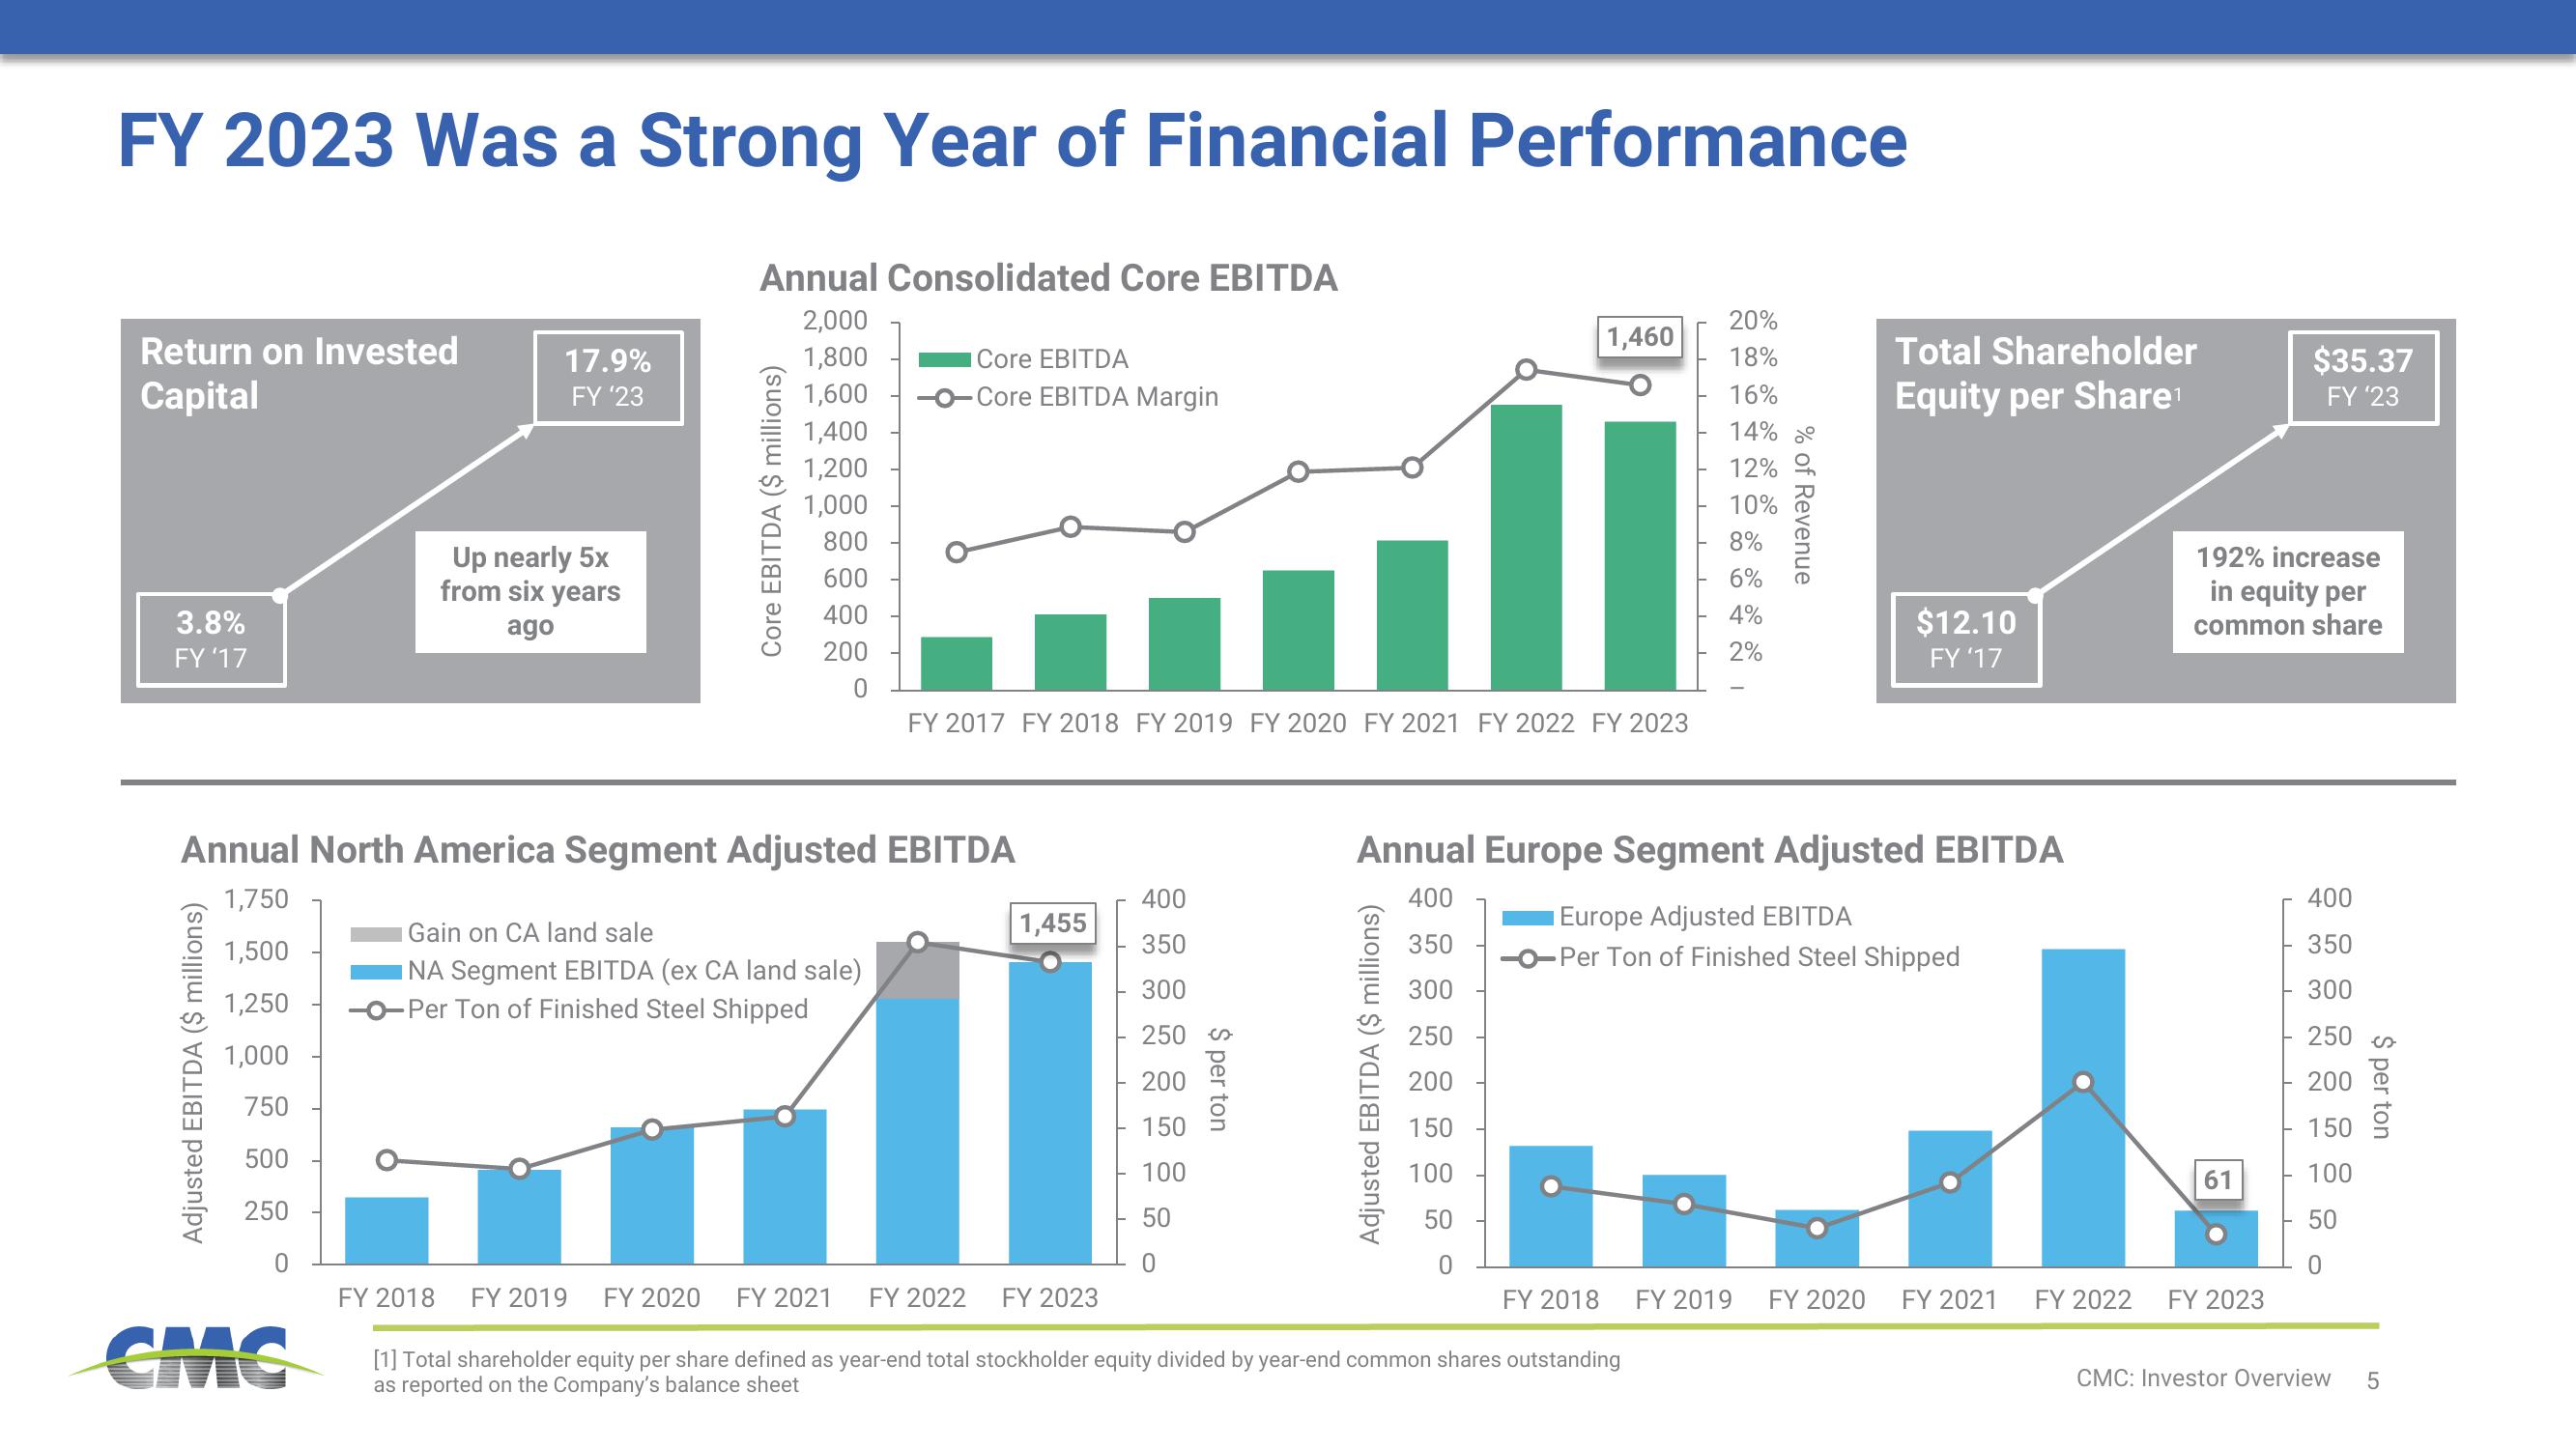
FY 2023 Was a Strong Year of Financial Performance
Return on Invested
Capital
3.8%
FY '17
17.9%
FY '23
Up nearly 5x
from six years
ago
Annual Consolidated Core EBITDA
2,000
1,800
1,600
Core EBITDA ($ millions)
וה
1,400
1,200
1,000
800
600
400
200
0
Gain on CA land sale
INA Segment EBITDA (ex CA land sale)
-o-Per Ton of Finished Steel Shipped
Annual North America Segment Adjusted EBITDA
1,750
1,500
1,250
1,000
750
500
250
0
Core EBITDA
Core EBITDA Margin
FY 2018 FY 2019 FY 2020 FY 2021
FY 2017 FY 2018 FY 2019 FY 2020 FY 2021 FY 2022 FY 2023
1,455
FY 2022 FY 2023
1,460
400
350
300
250
200
150
100
50
0
20%
18%
16%
14%
12%
10%
8%
6%
4%
2%
% of Revenue
FY 2018 FY 2019
[1] Total shareholder equity per share defined as year-end total stockholder equity divided by year-end common shares outstanding
as reported on the Company's balance sheet
Annual Europe Segment Adjusted EBITDA
400
350
300
250
200
150
100
50
0
Total Shareholder
Equity per Share¹
Europe Adjusted EBITDA
-0-Per Ton of Finished Steel Shipped
$12.10
FY '17
FY 2020
FY 2021
FY 2022
192% increase
in equity per
common share
61
$35.37
FY '23
FY 2023
400
350
300
250 s
200
150
100
50
0
CMC: Investor Overview
$ per ton
5View entire presentation