Li-Cycle SPAC Presentation Deck
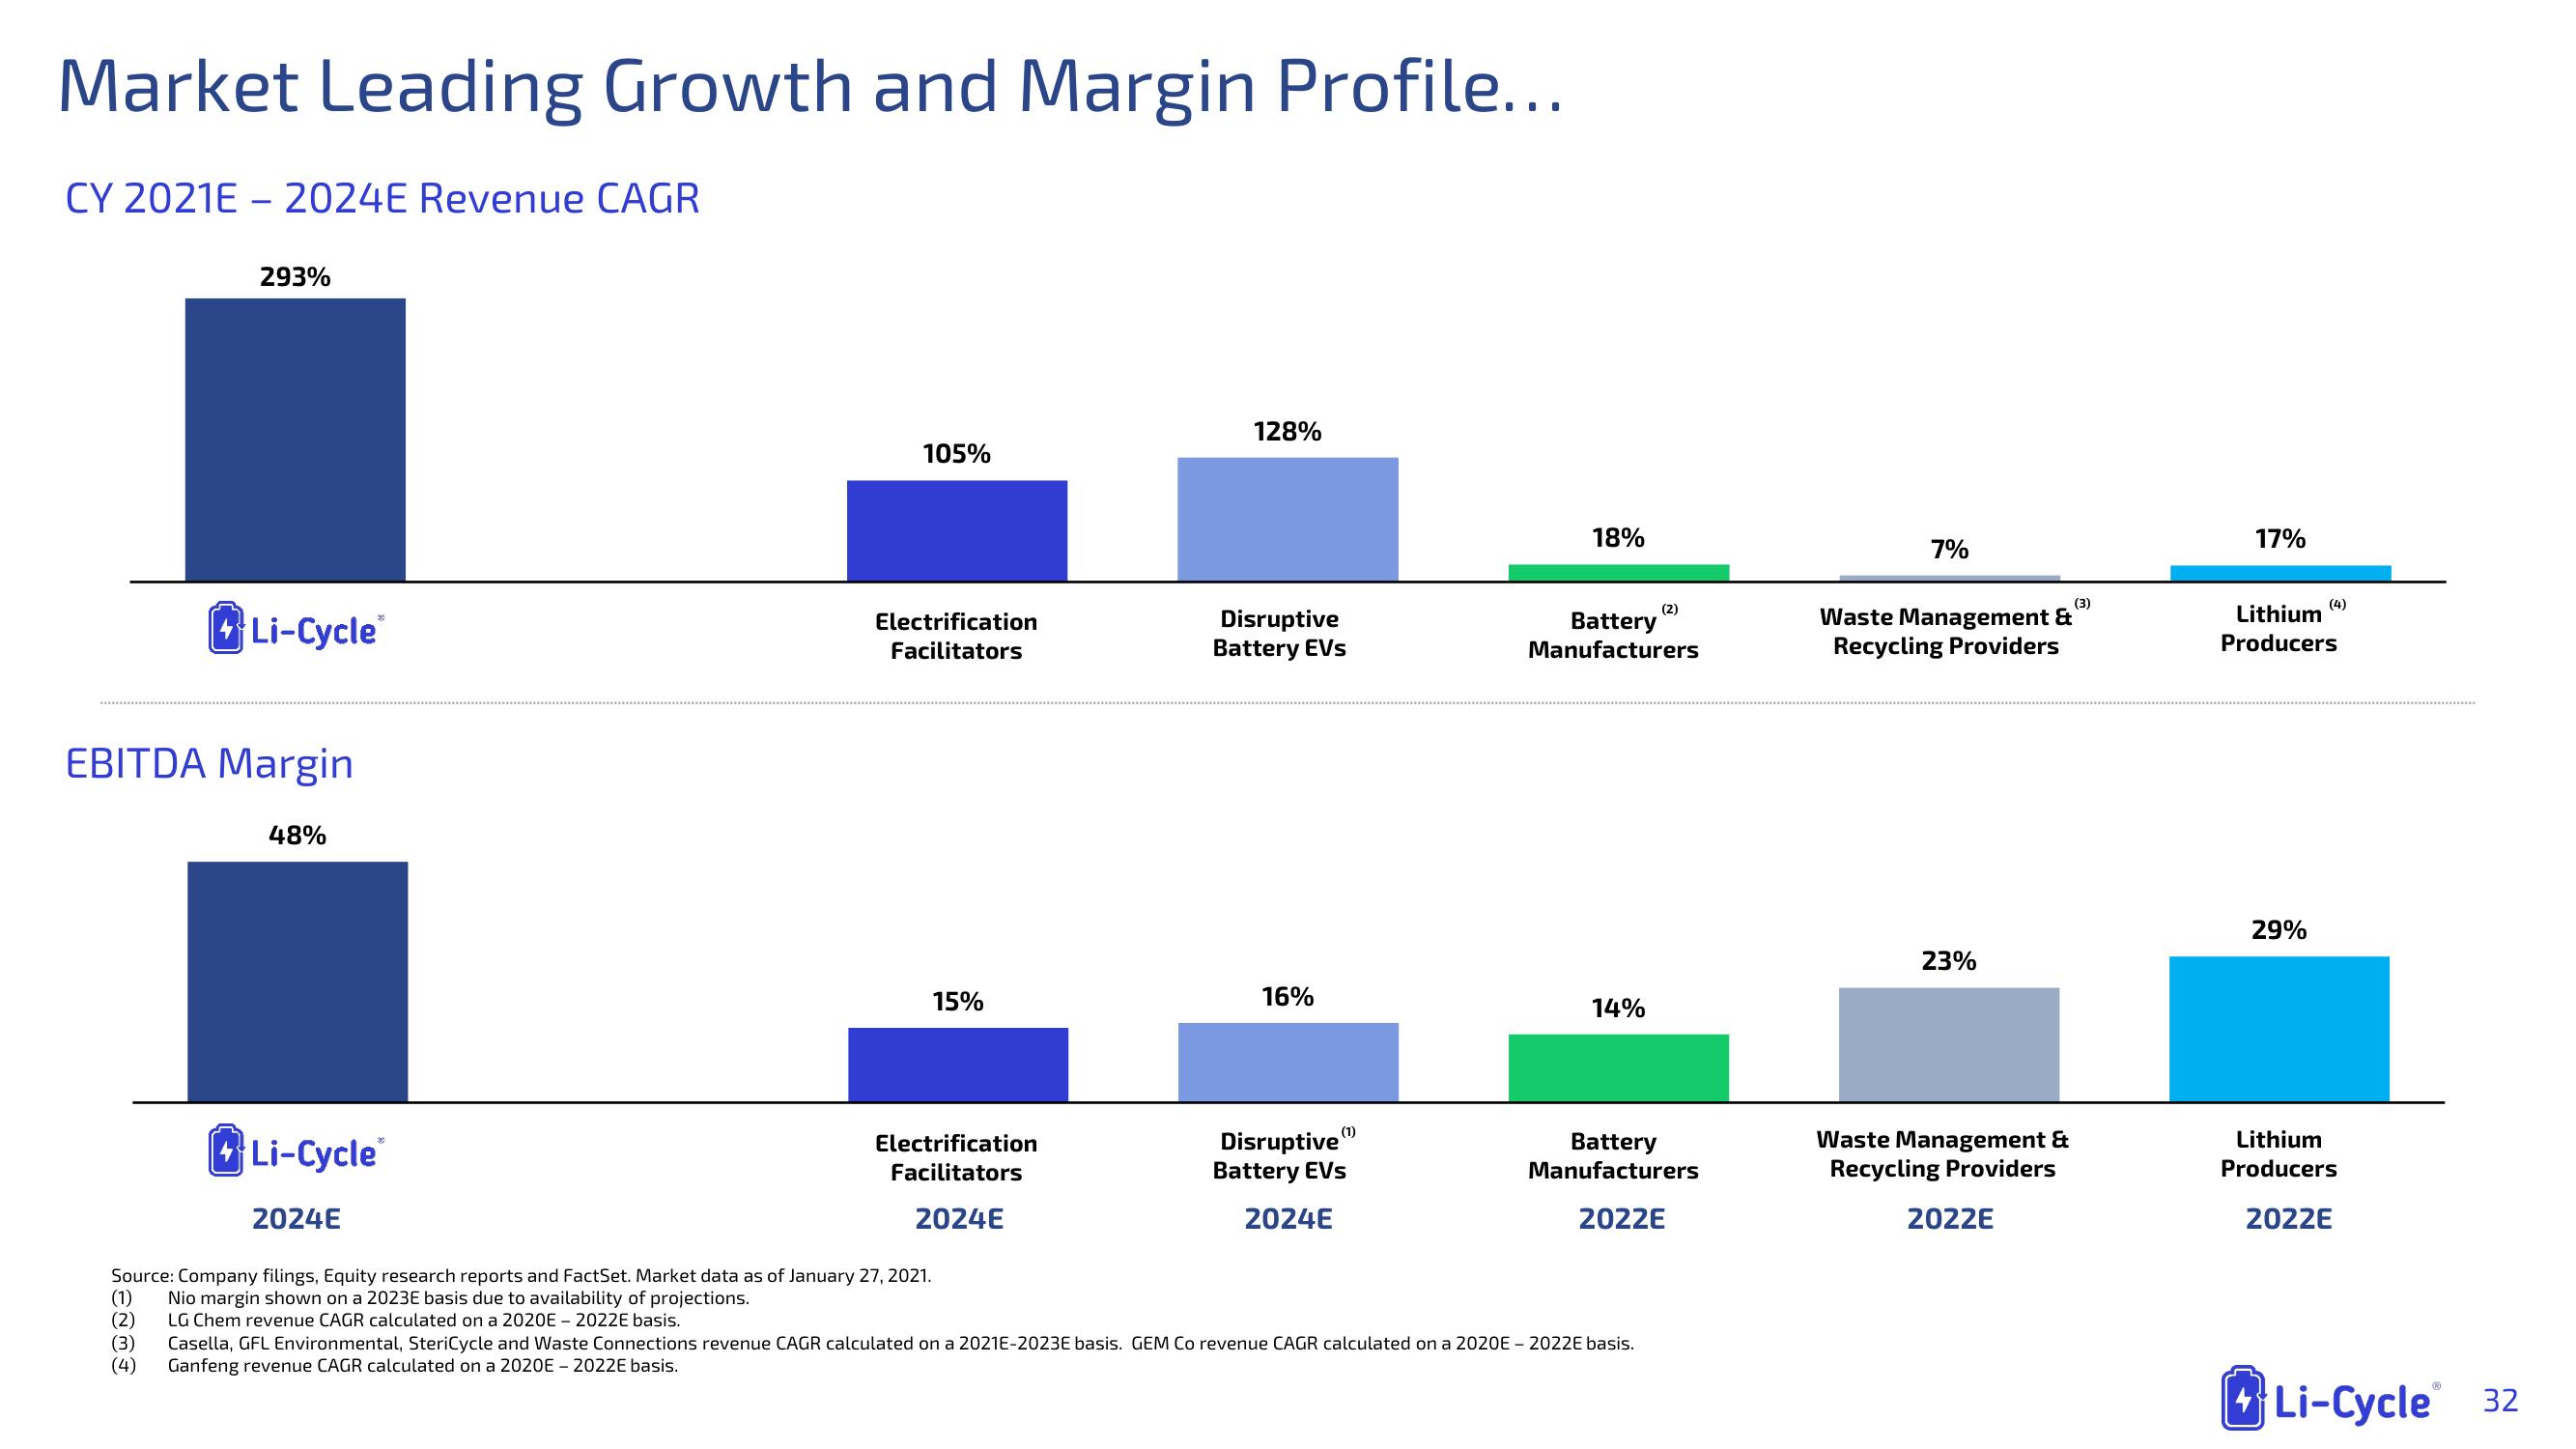
Market Leading Growth and Margin Profile...
CY 2021E-2024E Revenue CAGR
293%
Li-Cycle
EBITDA Margin
(1)
(2)
(3)
48%
30
Li-Cycle
2024E
105%
Electrification
Facilitators
15%
Electrification
Facilitators
2024E
Source: Company filings, Equity research reports and FactSet. Market data as of January 27, 2021.
Nio margin shown on a 2023E basis due to availability of projections.
LG Chem revenue CAGR calculated on a 2020E - 2022E basis.
128%
Disruptive
Battery EVs
16%
(1)
Disruptive
Battery EVs
2024E
18%
Battery
Manufacturers
14%
(2)
Battery
Manufacturers
2022E
Casella, GFL Environmental, SteriCycle and Waste Connections revenue CAGR calculated on a 2021E-2023E basis. GEM Co revenue CAGR calculated on a 2020E - 2022E basis.
Ganfeng revenue CAGR calculated on a 2020E - 2022E basis.
7%
(3)
Waste Management &
Recycling Providers
23%
Waste Management &
Recycling Providers
2022E
17%
(4)
Lithium
Producers
29%
Lithium
Producers
2022E
Li-Cycle 32View entire presentation