Forge Results Presentation Deck
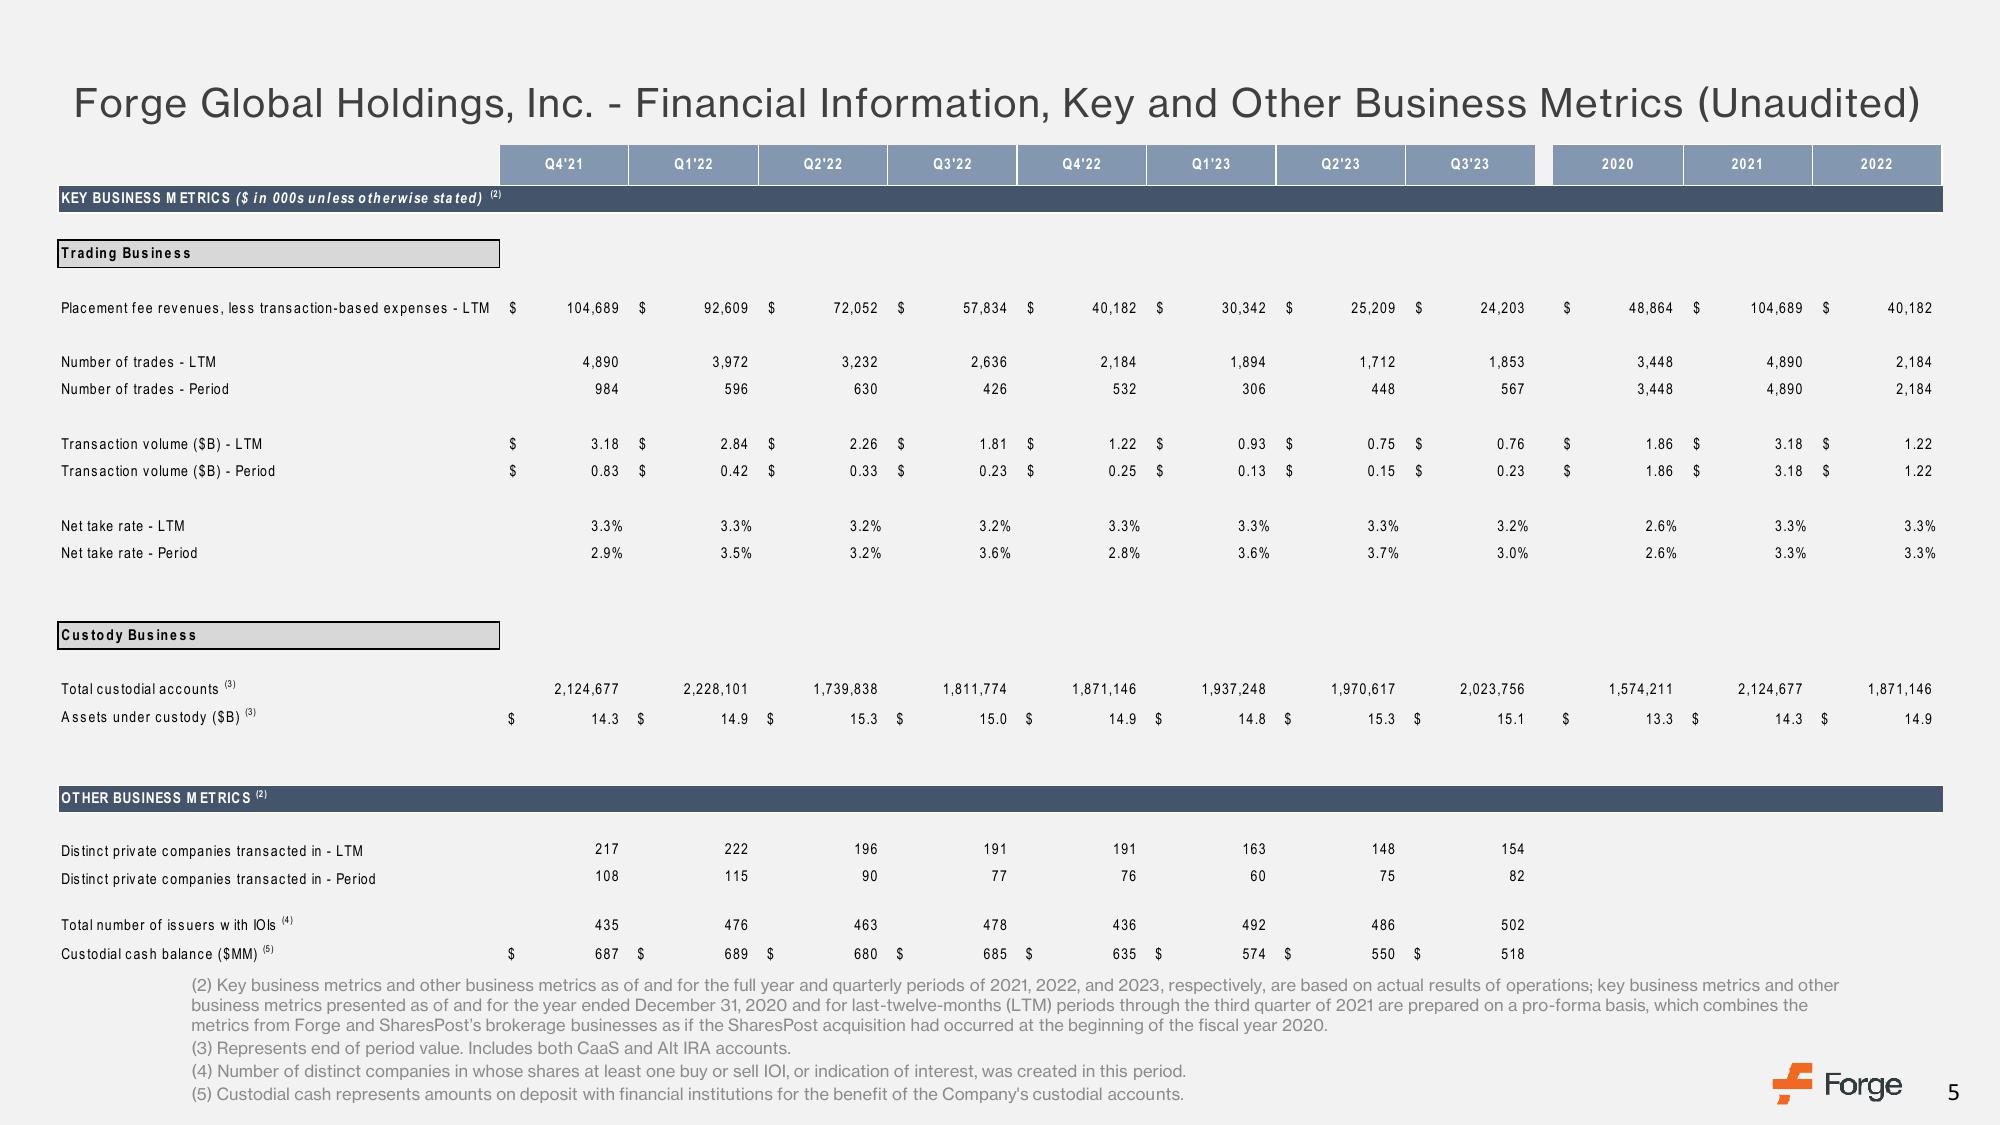
Forge Global Holdings, Inc. - Financial Information, Key and Other Business Metrics (Unaudited)
KEY BUSINESS METRICS ($ in 000s unless otherwise stated) (2)
Trading Business
Placement fee revenues, less transaction-based expenses LTM
Number of trades LTM
Number of trades - Period
Transaction volume (SB) - LTM
Transaction volume (SB) - Period
Net take rate - LTM
Net take rate - Period
Custody Business
Total custodial accounts
(3)
Assets under custody (SB) (3)
OTHER BUSINESS METRICS (2)
Distinct private companies transacted in LTM
Distinct private companies transacted in Period
$
$
$
$
Q4'21
104,689 $
4,890
984
3.18
$
0.83 $
3.3%
2.9%
2,124,677
14.3 $
217
108
Q1'22
92,609
3,972
596
2.84
0.42
3.3%
3.5%
$
222
115
$
$
2,228,101
14.9 $
Q2'22
476
689 $
72,052 $
3,232
630
2.26
0.33
3.2%
3.2%
1,739,838
$
$
15.3 $
196
90
Q3'22
57,834 $
2,636
426
1.81
0.23
3.2%
3.6%
1,811,774
$
$
15.0 $
191
77
Q4'22
40,182 $
2,184
532
1.22 $
0.25 $
3.3%
2.8%
1,871,146
14.9 $
191
76
436
635 $
Q1'23
(4) Number of distinct companies in whose shares at least one buy or sell IOI, or indication of interest, was created in this period.
(5) Custodial cash represents amounts on deposit with financial institutions for the benefit of the Company's custodial accounts.
30,342
1,894
306
0.93
0.13
3.3%
3.6%
$
163
60
$
$
1,937,248
14.8 $
Q2'23
25,209
1,712
448
0.75
0.15
3.3%
3.7%
$
148
75
$
$
1,970,617
15.3 $
Q3'23
486
550 $
24,203
1,853
567
0.76
0.23
3.2%
3.0%
2,023,756
154
82
$
15.1 $
$
$
502
518
2020
48,864
3,448
3,448
1.86 $
1.86 $
2.6%
2.6%
$
1.574,211
13.3 $
2021
104,689 $
4,890
4,890
Total number of issuers with 10ls (4)
Custodial cash balance ($MM) (5)
435
687 $
463
680 $
478
685 $
492
574 $
$
(2) Key business metrics and other business metrics as of and for the full year and quarterly periods of 2021, 2022, and 2023, respectively, are based on actual results of operations; key business metrics and other
business metrics presented as of and for the year ended December 31, 2020 and for last-twelve-months (LTM) periods through the third quarter of 2021 are prepared on a pro-forma basis, which combines the
metrics from Forge and SharesPost's brokerage businesses as if the SharesPost acquisition had occurred at the beginning of the fiscal year 2020.
(3) Represents end of period value. Includes both CaaS and Alt IRA accounts.
3.18 $
3.18 S
3.3%
3.3%
2,124,677
14.3 $
2022
40,182
2,184
2,184
1.22
1.22
Forge
3.3%
3.3%
1,871,146
14.9
01
5View entire presentation