J.P.Morgan 2Q23 Investor Results
JPMORGAN CHASE & CO.
CORPORATE & INVESTMENT BANK
FINANCIAL HIGHLIGHTS
(in millions, except ratio data)
INCOME STATEMENT
REVENUE
Investment banking fees (a)
Principal transactions
Lending- and deposit-related fees
Commissions and other fees
Card income
All other income
Noninterest revenue
Net interest income
TOTAL NET REVENUE (b)
Provision for credit losses
NONINTEREST EXPENSE
Compensation expense
Noncompensation expense
TOTAL NONINTEREST EXPENSE
Income before income tax expense
Income tax expense
NET INCOME
FINANCIAL RATIOS
ROE
Overhead ratio
Compensation expense as percentage of total net revenue
REVENUE BY BUSINESS
Investment Banking
Payments
Lending
Total Banking
Fixed Income Markets
Equity Markets
Securities Services
Credit Adjustments & Other (c)
Total Markets & Securities Services
TOTAL NET REVENUE
$
$
$
$
2Q23
1,557
6,697
533
1,219
400
396
10,802
1,717
12,519
38
3,461
3,433
6,894
5,587
1,495
4,092
15 %
55
28
1,494
2,451
299
4,244
4,567
2,451
1,221
36
8,275
12,519
$
1Q23
$
1,654
7,408
539
1,234
315
373
11,523
2,077
13,600
58
4,085
3,398
7,483
6,059
1,638
$ 4,421
16 %
55
30
1,560
2,396
267
4,223
5,699
2,683
1,148
(153)
9,377
$ 13,600
$
4Q22
$
1,467
4,397
548
1,200
353
147
8,112
2,486
10,598
141
3,091
3,404
6,495
3,962
648
$ 3,314
12%
61
29
QUARTERLY TRENDS
1,931
1,159
(63)
6,766
$ 10,598
(d)
(d)
(d)
1,389
2,120 (d)
323
3,832
3,739
(d)
$
$
$
3Q22
1,762
5,258
589
1,198
293
181
9,281
2,644
11,925
513
3,311
3,371
6,682
4,730
1,208
3,522
13 %
56
28
4,075
4,469
2,302
1,110
1,713
2,039 (d)
323
(31)
(d)
(d)
7,850
$ 11,925
(d)
(d)
$
$
2Q22
1,650
5,048
641
1,328
337 (d)
(199)
(d)
8,805
3,198
12,003
59
3,510
3,300
6,810
5,134
1,417
3,717
14 %
57
29
3,280
4,711
3,079
1,151
(218)
(d)
1,351
1,519 (d)
410
8,723
$ 12,003
(d)
(d)
2Q23 Change
1Q23
(6)%
(10)
(1)
(1)
27
6
(6)
(17)
(8)
(34)
(15)
1
(8)
(8)
(9)
(7)
(4)
2
12
(20)
(9)
6
NM
(12)
(8)
JPMORGAN CHASE & CO.
2Q22
(6)%
33
(17)
(8)
19
NM
23
(46)
4
(36)
(1)
4
1
9
6
10
11
61
(27)
29
(3)
(20)
6
NM
(5)
4
$
2023
$ 3,211
14,105
1,072
2,453
715
769
22,325
3,794
26,119
$
96
7,546
6,831
14,377
11,646
3,133
8,513
15 %
55
29
3,054
4,847
566
SIX MONTHS ENDED JUNE 30,
8,467
10,266
5,134
2,369
(117)
17,652
$ 26,119
$
$
$
2022
3,700
10,271
1,282
2,660
603
293
18,809
6,770
25,579
504
7,516
6,657
14,173
10,902
2,813
8,089
15%
55
29
3,408
3,420
731
7,559
10,409
6,134
2,219
(742)
18,020
$ 25,579
(d)
(d)
(d)
(d)
(d)
(d)
2023 Change
2022
(13)%
37
(16)
(8)
19
162
19
(44)
2
(81)
|
3
1
7
11
5
(10)
42
(23)
12
(1)
(16)
7
84
(2)
2
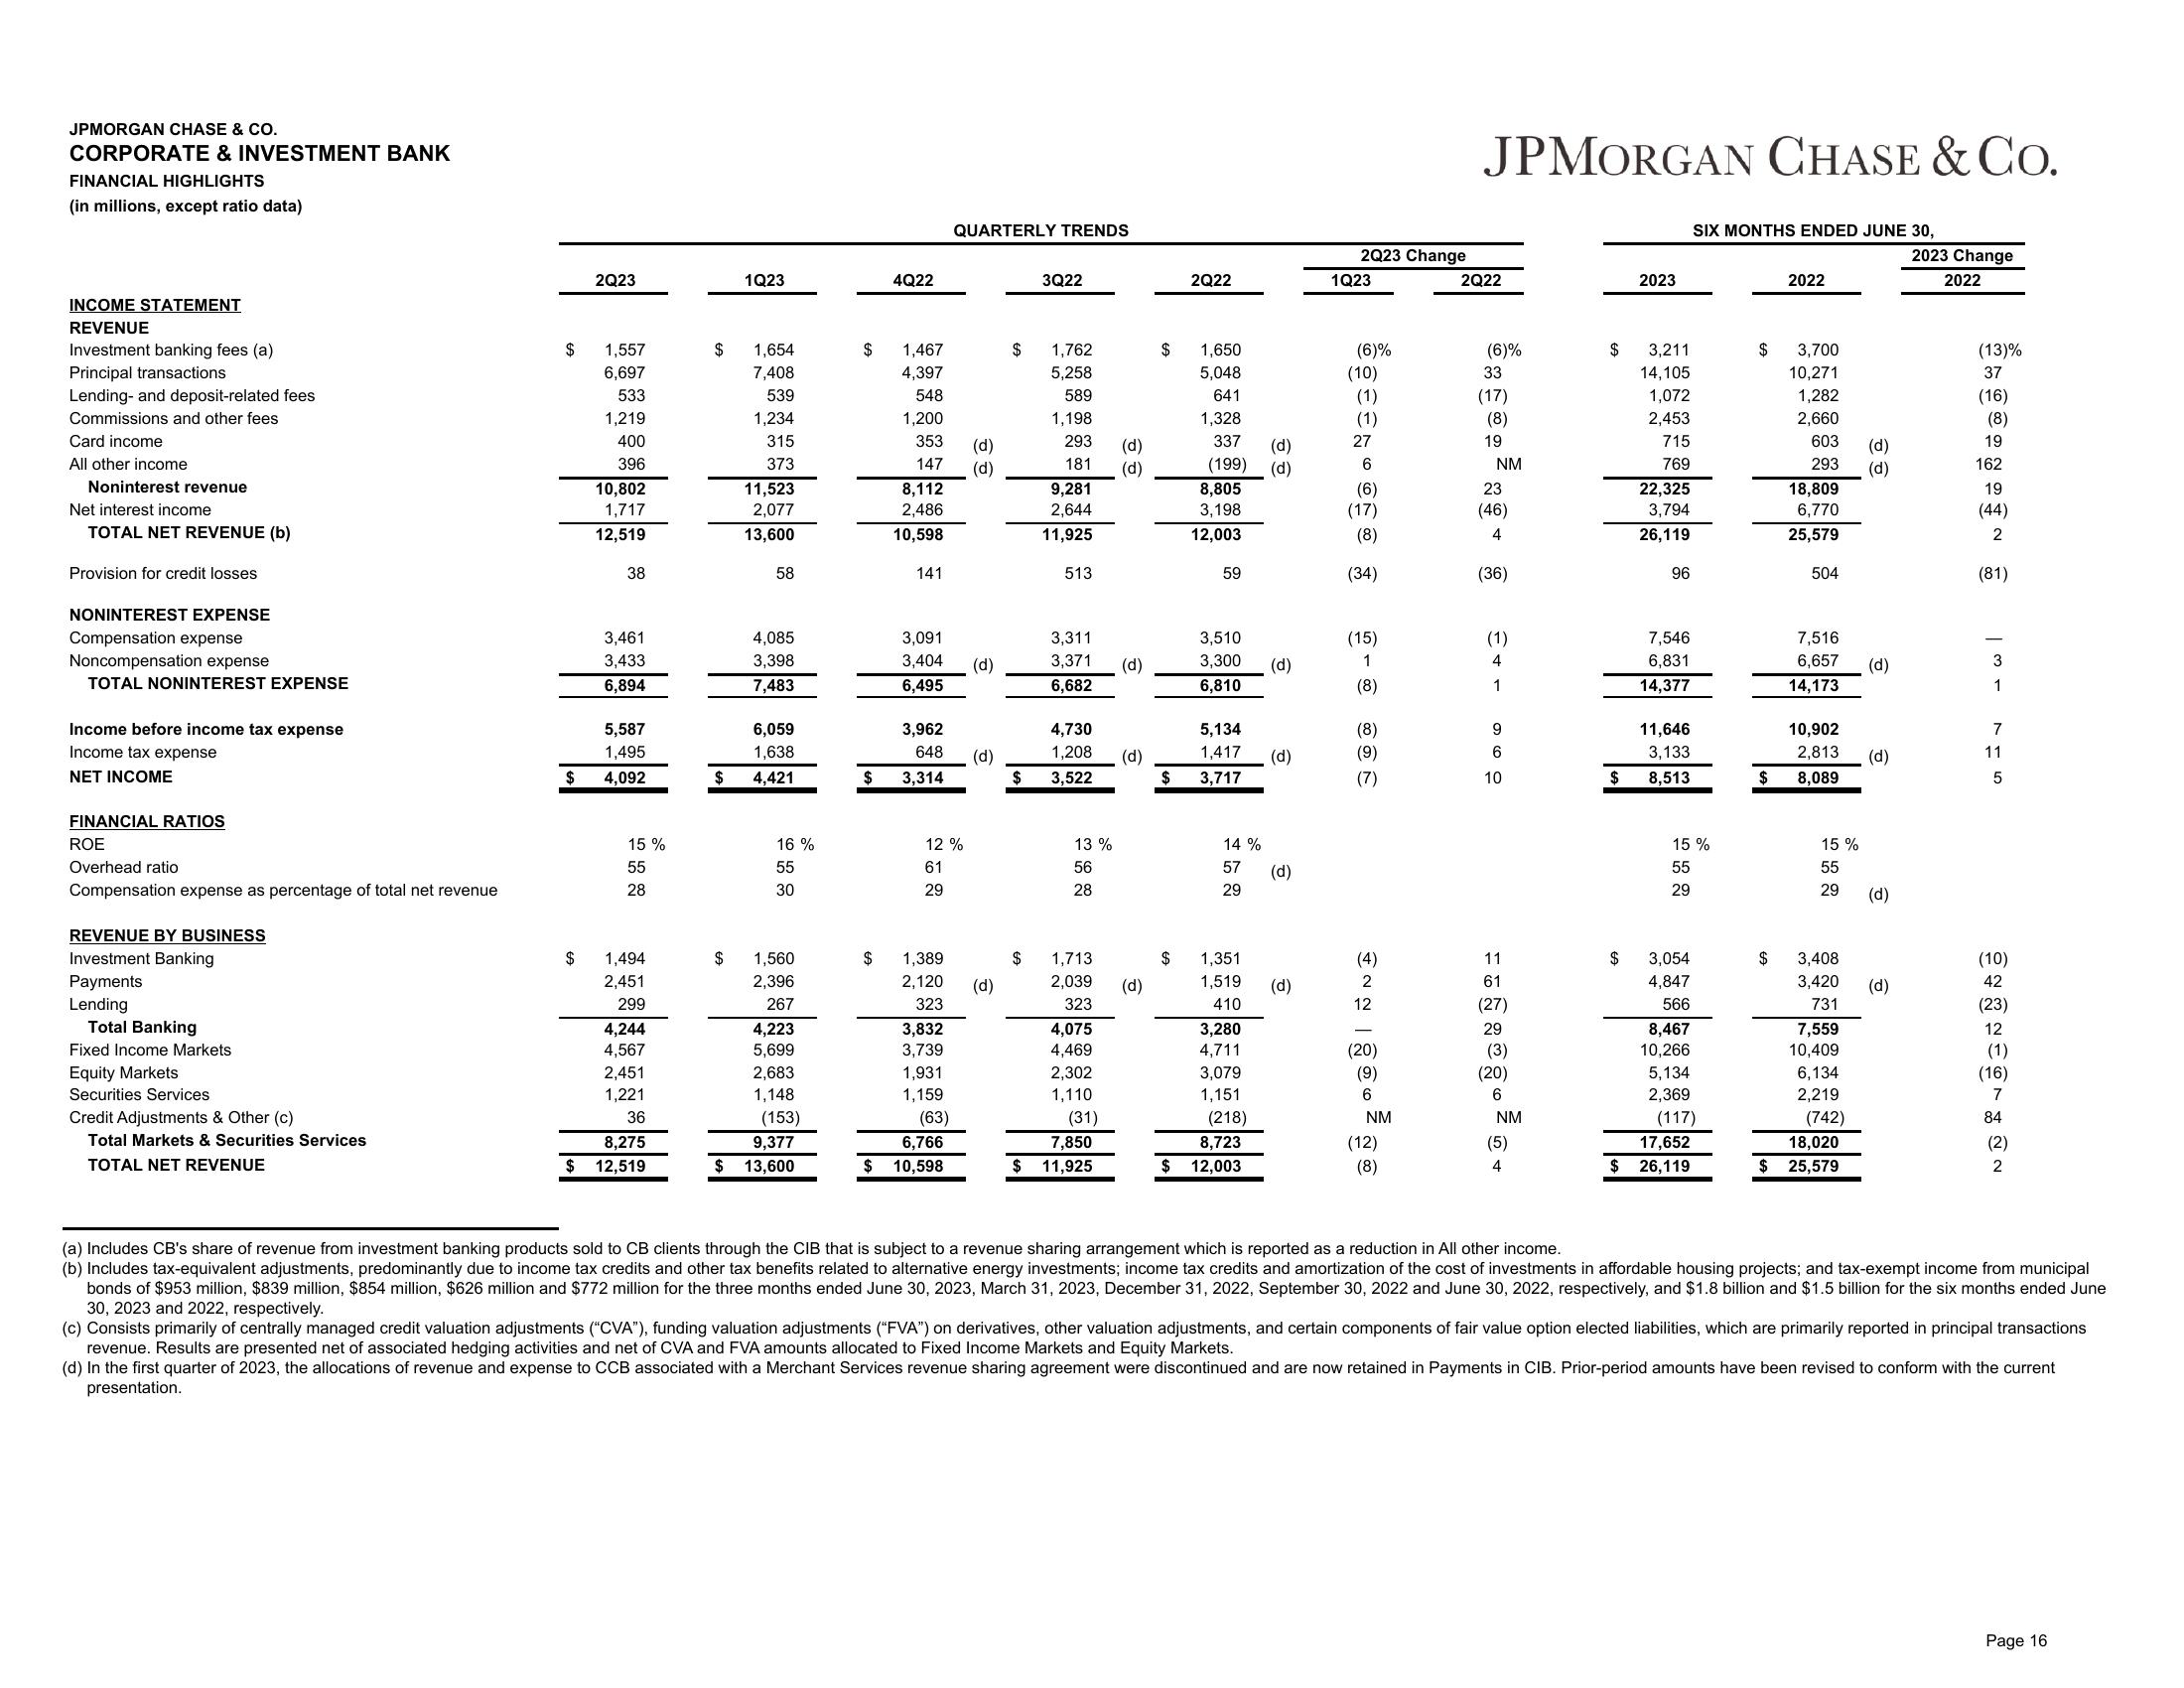
(a) Includes CB's share of revenue from investment banking products sold to CB clients through the CIB that is subject to a revenue sharing arrangement which is reported as a reduction in All other income.
(b) Includes tax-equivalent adjustments, predominantly due to income tax credits and other tax benefits related to alternative energy investments; income tax credits and amortization of the cost of investments in affordable housing projects; and tax-exempt income from municipal
bonds of $953 million, $839 million, $854 million, $626 million and $772 million for the three months ended June 30, 2023, March 31, 2023, December 31, 2022, September 30, 2022 and June 30, 2022, respectively, and $1.8 billion and $1.5 billion for the six months ended June
30, 2023 and 2022, respectively.
(c) Consists primarily of centrally managed credit valuation adjustments ("CVA"), funding valuation adjustments ("FVA") on derivatives, other valuation adjustments, and certain components of fair value option elected liabilities, which are primarily reported in principal transactions
revenue. Results are presented net of associated hedging activities and net of CVA and FVA amounts allocated to Fixed Income Markets and Equity Markets.
(d) In the first quarter of 2023, the allocations of revenue and expense to CCB associated with a Merchant Services revenue sharing agreement were discontinued and are now retained in Payments in CIB. Prior-period amounts have been revised to conform with the current
presentation.
Page 16View entire presentation