Playboy SPAC Presentation Deck
PLAYBOY 2020
35
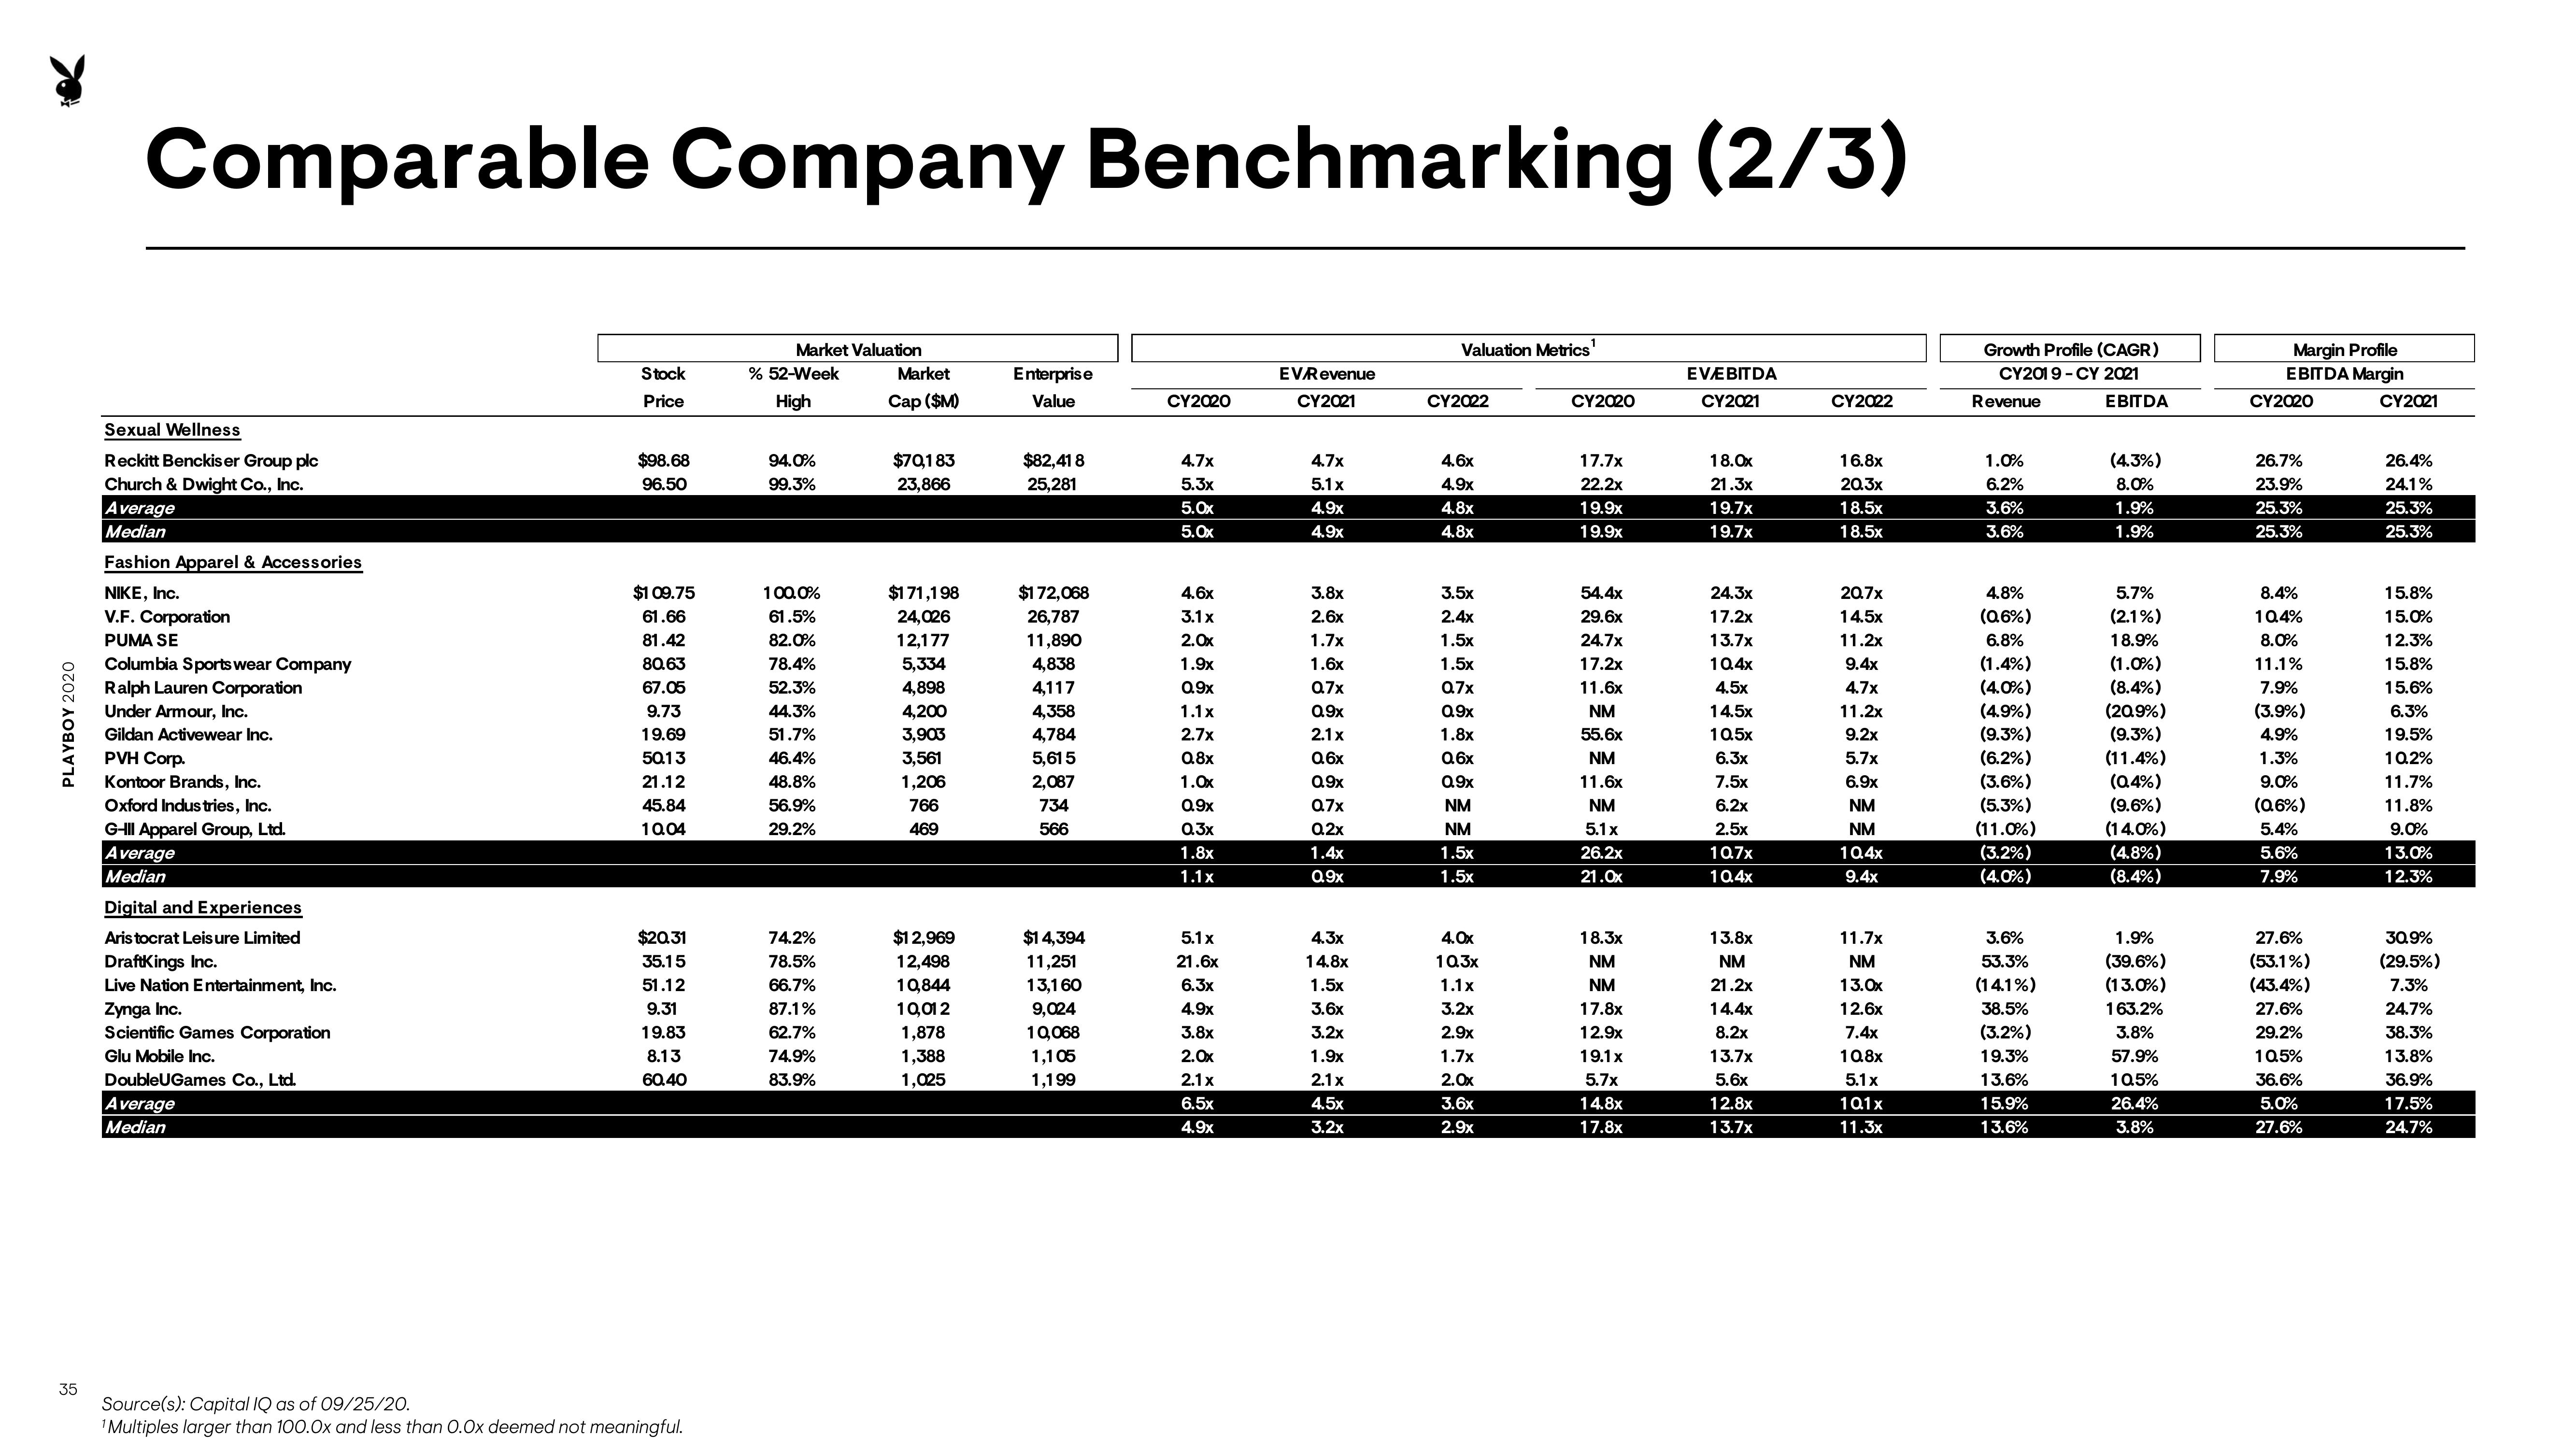
Comparable Company Benchmarking (2/3)
Sexual Wellness
Reckitt Benckiser Group plc
Church & Dwight Co., Inc.
Average
Median
Fashion Apparel & Accessories
NIKE, Inc.
V.F. Corporation
PUMA SE
Columbia Sportswear Company
Ralph Lauren Corporation
Under Armour, Inc.
Gildan Activewear Inc.
PVH Corp.
Kontoor Brands, Inc.
Oxford Industries, Inc.
G-III Apparel Group, Ltd.
Average
Median
Digital and Experiences
Aristocrat Leisure Limited
DraftKings Inc.
Live Nation Entertainment, Inc.
Zynga Inc.
Scientific Games Corporation
Glu Mobile Inc.
DoubleUGames Co., Ltd.
Average
Median
Stock
Price
$98.68
96.50
$109.75
61.66
81.42
80.63
67.05
9.73
19.69
50.13
21.12
45.84
10.04
$20.31
35.15
51.12
9.31
19.83
8.13
60.40
Source(s): Capital IQ as of 09/25/20.
¹Multiples larger than 100.0x and less than 0.0x deemed not meaningful.
Market Valuation
% 52-Week
High
94.0%
99.3%
100.0%
61.5%
82.0%
78.4%
52.3%
44.3%
51.7%
46.4%
48.8%
56.9%
29.2%
74.2%
78.5%
66.7%
87.1%
62.7%
74.9%
83.9%
Market
Cap ($M)
$70,183
23,866
$171,198
24,026
12,177
5,334
4,898
4,200
3,903
3,561
1,206
766
469
$12,969
12,498
10,844
10,012
1,878
1,388
1,025
Enterprise
Value
$82,41 8
25,281
$172,068
26,787
11,890
4,838
4,117
4,358
4,784
5,61 5
2,087
734
566
$14,394
11,251
13,160
9,024
10,068
1,105
1,199
CY2020
4.7x
5.3x
5.0x
5.0x
4.6x
3.1x
2.0x
1.9x
09x
1.1x
2.7x
0.8x
1.0x
0.9x
0.3x
1.8x
1.1x
5.1x
21.6x
6.3x
4.9x
3.8x
2.0x
2.1x
6.5x
EV/Revenue
CY2021
4.7x
5.1x
4.9x
4.9x
3.8x
2.6x
1.7x
1.6x
0.7x
09x
2.1x
0.6x
09x
Q7x
Q2x
1.4x
0.9x
4.3x
14.8x
1.5x
3.6x
3.2x
1.9x
2.1x
4.5x
3.2x
Valuation Metrics¹
CY2022
4.6x
4.9x
4.8x
4.8x
3.5x
2.4x
1.5x
1.5x
Q7x
09x
1.8x
a6x
09x
NM
NM
1.5x
1.5x
4.0x
103x
1.1x
3.2x
2.9x
1.7x
2.0x
3.6x
2.9x
CY2020
17.7x
22.2x
19.9x
19.9x
54.4x
29.6x
24.7x
17.2x
11.6x
NM
55.6x
NM
11.6x
NM
5.1 x
26.2x
21.0x
18.3x
NM
NM
17.8x
12.9x
19.1x
5.7x
14.8x
17.8x
EVEBITDA
CY2021
18.0x
21.3x
19.7x
19.7x
24.3x
17.2x
13.7x
10.4x
4.5x
145
105x
6.3x
7.5x
6.2x
2.5x
10.7x
10.4x
13.8x
NM
21.2x
14.4x
8.2x
13.7x
5.6x
12.8x
13.7x
CY2022
16.8x
20.3x
18.5x
18.5x
20.7x
145x
11.2x
9.4x
4.7x
11.2x
9.2x
5.7x
6.9x
NM
NM
10.4x
9.4x
11.7x
NM
13.0x
12.6x
7.4x
10.8x
5.1x
101x
11.3x
Growth Profile (CAGR)
CY2019-CY 2021
EBITDA
Revenue
1.0%
6.2%
3.6%
3.6%
4.8%
(0.6%)
6.8%
(1.4%)
(4.0%)
(4.9%)
(9.3%)
(6.2%)
(3.6%)
(5.3%)
(11.0%)
(3.2%)
(4.0%)
3.6%
53.3%
(14.1%)
38.5%
(3.2%)
19.3%
13.6%
15.9%
13.6%
(4.3%)
8.0%
1.9%
1.9%
5.7%
(2.1%)
18.9%
(1.0%)
(8.4%)
(20.9%)
(9.3%)
(11.4%)
(0.4%)
(9.6%)
(14.0%)
(4.8%)
(8.4%)
1.9%
(39.6%)
(13.0%)
163.2%
3.8%
57.9%
10.5%
26.4%
3.8%
Margin Profile
EBITDA Margin
CY2020
26.7%
23.9%
25.3%
25.3%
8.4%
10.4%
8.0%
11.1%
7.9%
(3.9%)
4.9%
1.3%
9.0%
(0.6%)
5.4%
5.6%
7.9%
27.6%
(53.1%)
(43.4%)
27.6%
29.2%
10.5%
36.6%
5.0%
27.6%
CY2021
26.4%
24.1%
25.3%
25.3%
15.8%
15.0%
12.3%
15.8%
15.6%
6.3%
19.5%
10.2%
11.7%
11.8%
9.0%
13.0%
12.3%
30.9%
(29.5%)
7.3%
24.7%
38.3%
13.8%
36.9%
17.5%
24.7%View entire presentation