Credit Suisse Results Presentation Deck
Group Overview
Reported
Adjusted
14
Credit Suisse Group
in CHF mn
Net revenues
Provision for credit losses
Total operating expenses
Pre-tax income
Effective tax rate
Net income/(loss) attributable to shareholders
Return on tangible equity
Cost/income ratio
Net revenues
Provision for credit losses
Total operating expenses
Pre-tax income
2022
3,645
64
4,754
(1,173)
(36)%
(1,593)
(15.0)%
130%
3,820
64
4,198
(442)
1Q22
4,412
(110)
4,950
(428)
35%
(273)
(2.6)%
112%
4,582
45
4,237
300
2Q21
5,103
(25)
4,315
813
70%
253
2.6%
85%
5,226
(95)
4,008
1,313
Δ 1022
(17)%
(4)%
n/m
n/m
(17)%
(1) %
n/m
A 2Q21
(29)%
10%
n/m
n/m
(27)%
5%
n/m
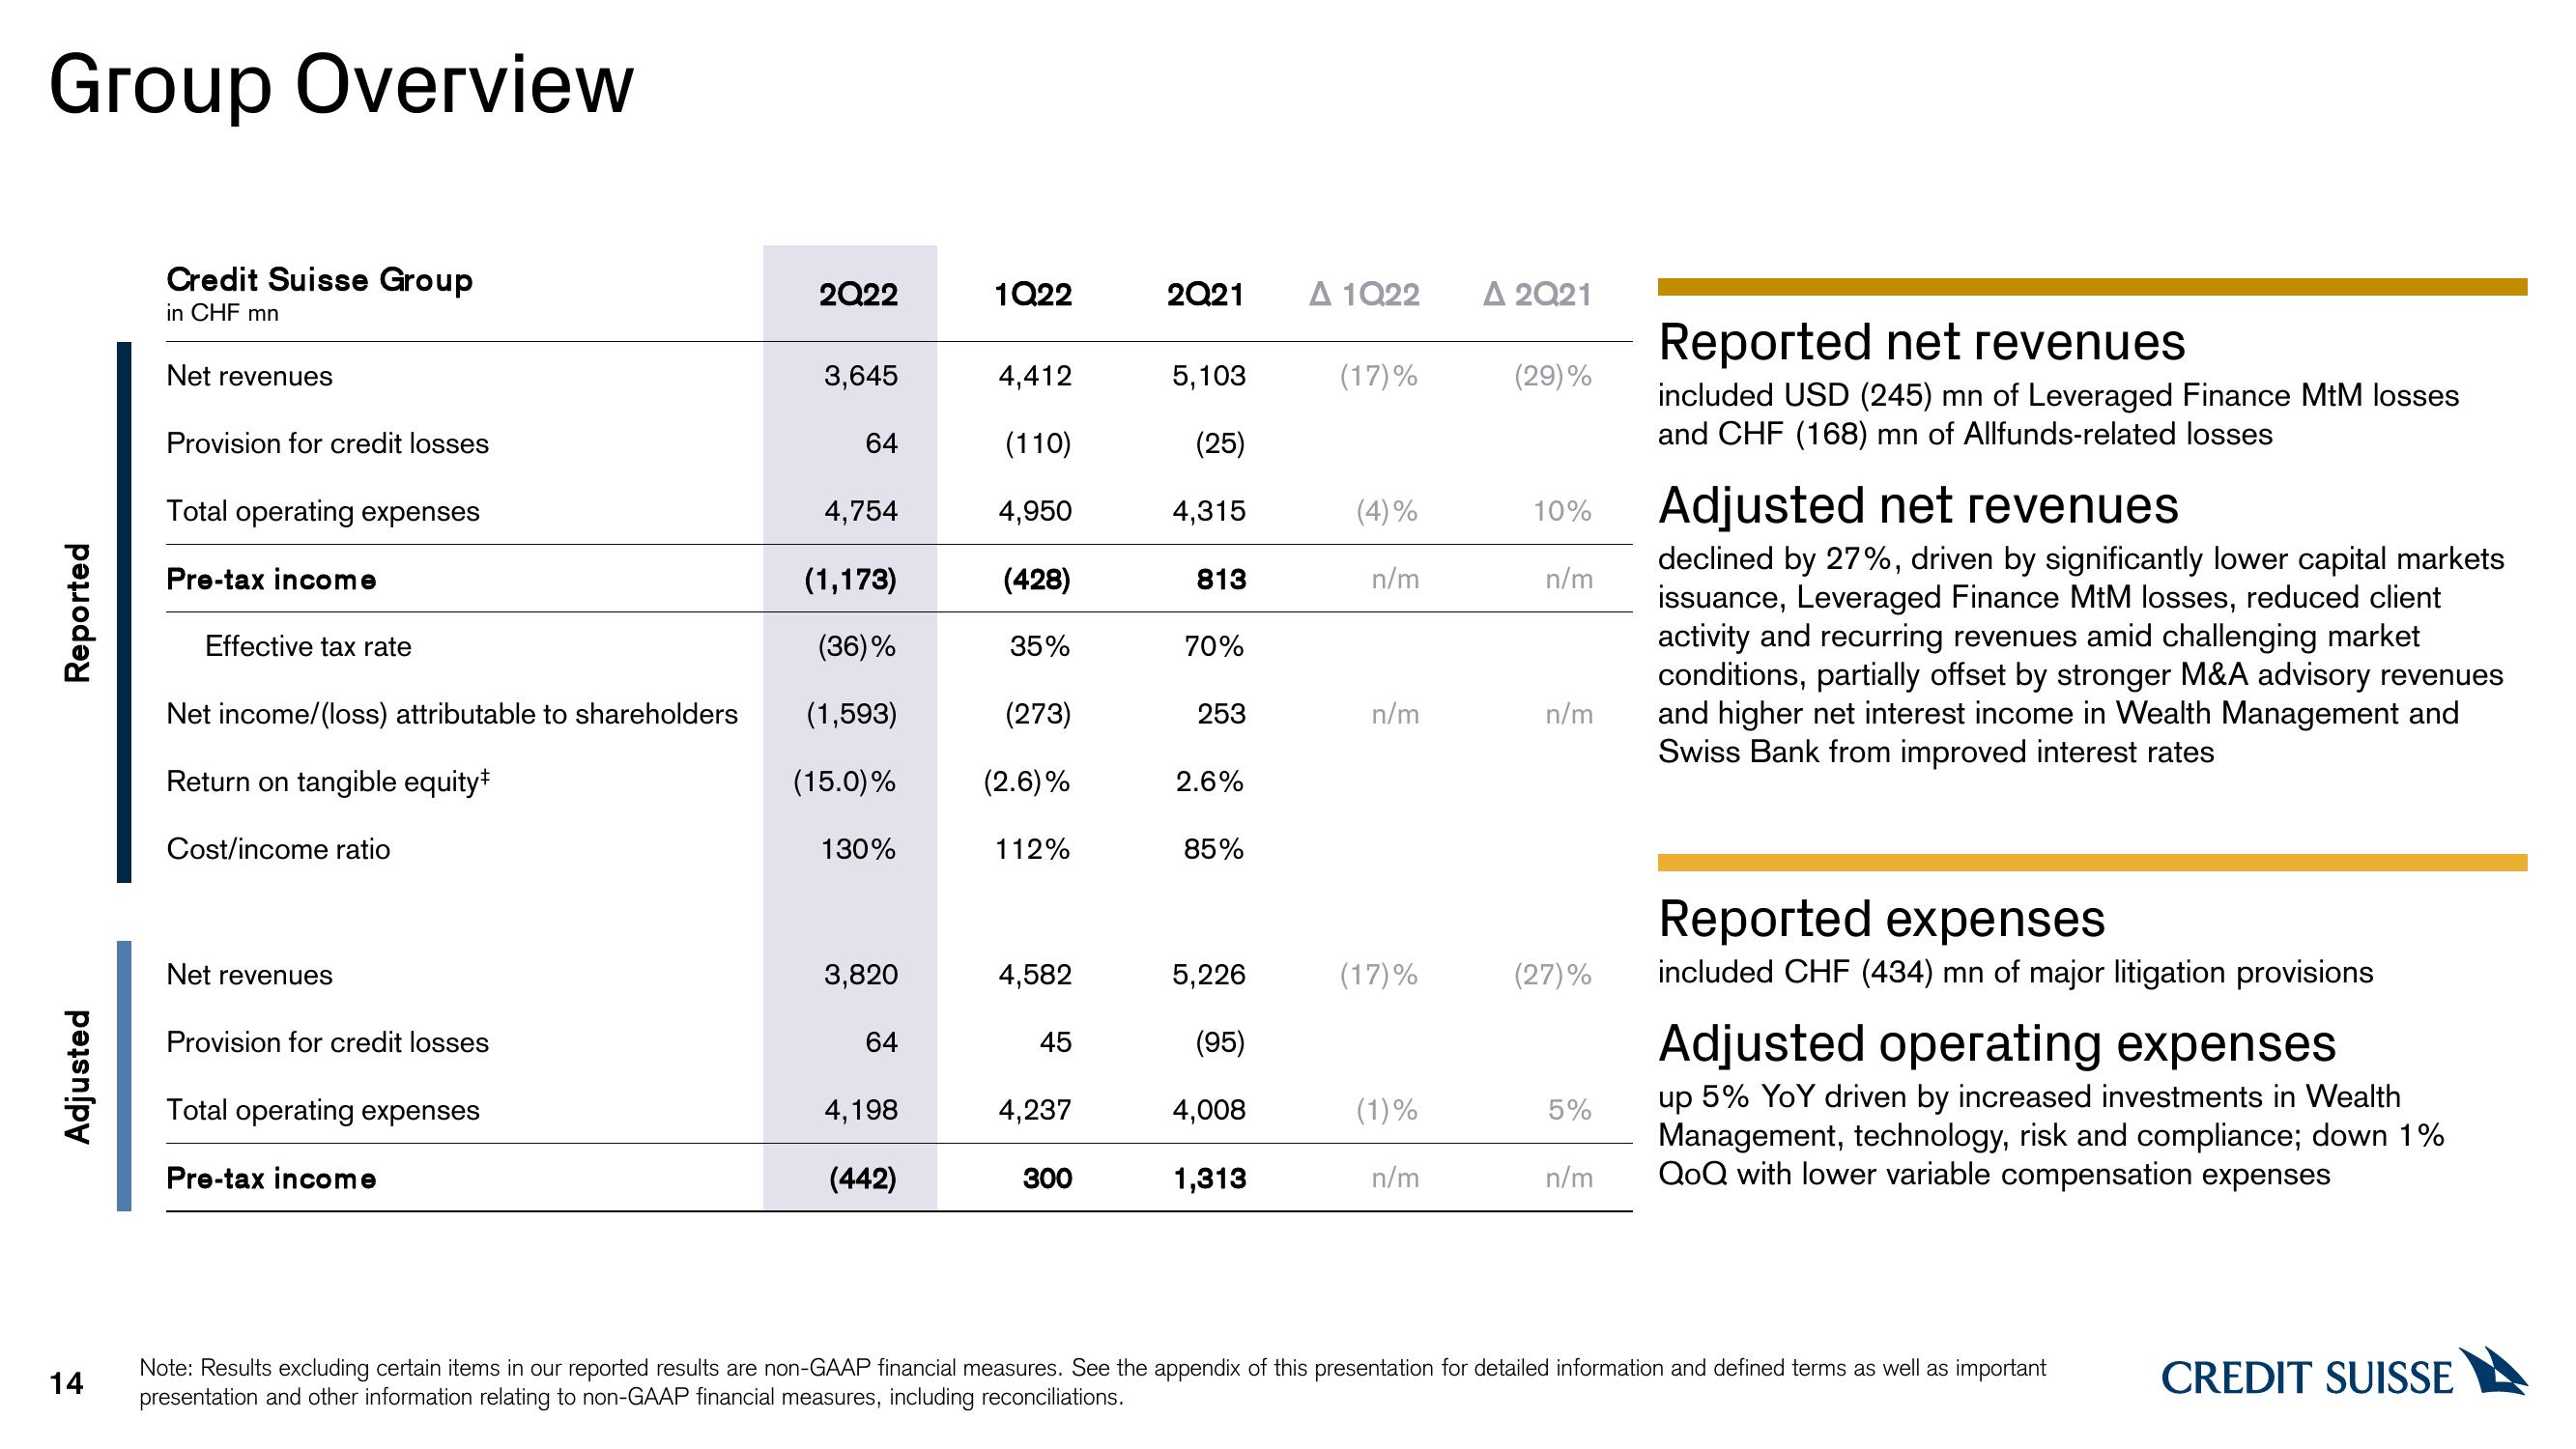
Reported net revenues
included USD (245) mn of Leveraged Finance MtM losses
and CHF (168) mn of Allfunds-related losses
Adjusted net revenues
declined by 27%, driven by significantly lower capital markets
issuance, Leveraged Finance MtM losses, reduced client
activity and recurring revenues amid challenging market
conditions, partially offset by stronger M&A advisory revenues
and higher net interest income in Wealth Management and
Swiss Bank from improved interest rates
Reported expenses
included CHF (434) mn of major litigation provisions
Adjusted operating expenses
up 5% YoY driven by increased investments in Wealth
Management, technology, risk and compliance; down 1%
QoQ with lower variable compensation expenses
Note: Results excluding certain items in our reported results are non-GAAP financial measures. See the appendix of this presentation for detailed information and defined terms as well as important
presentation and other information relating to non-GAAP financial measures, including reconciliations.
CREDIT SUISSEView entire presentation