MP Materials Results Presentation Deck
11
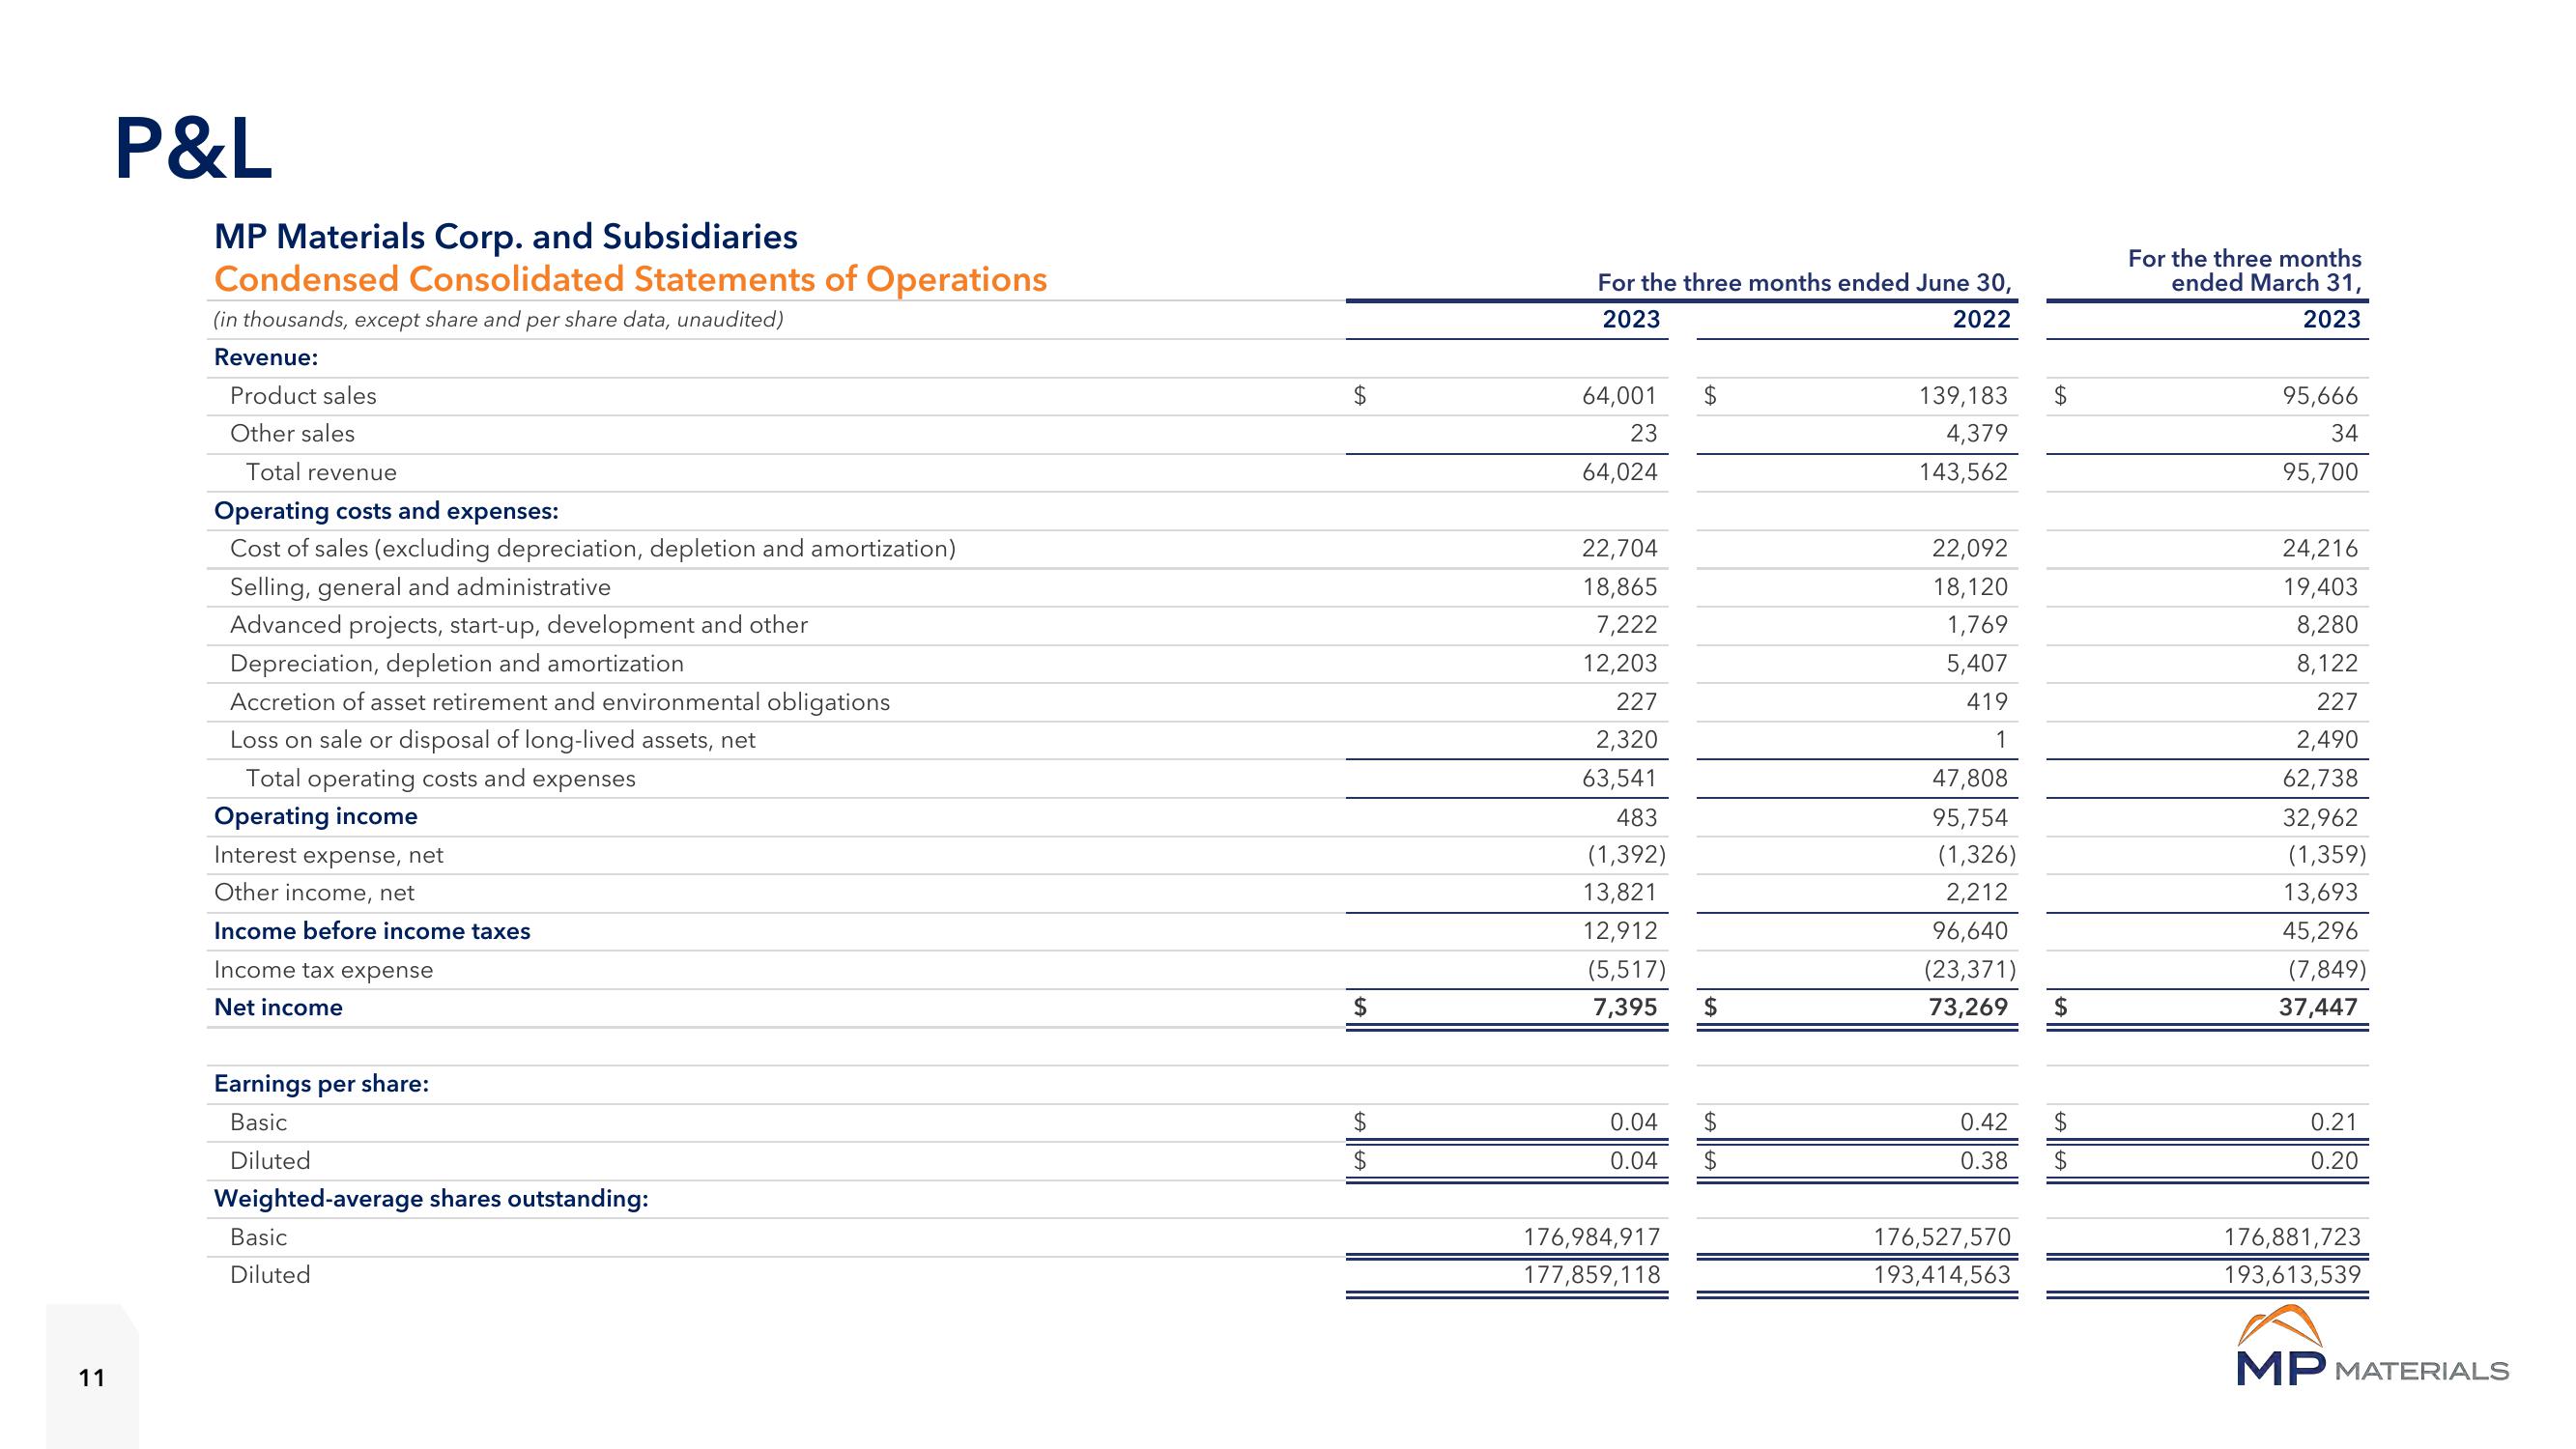
P&L
MP Materials Corp. and Subsidiaries
Condensed Consolidated Statements of Operations
(in thousands, except share and per share data, unaudited)
Revenue:
Product sales
Other sales
Total revenue
Operating costs and expenses:
Cost of sales (excluding depreciation, depletion and amortization)
Selling, general and administrative
Advanced projects, start-up, development and other
Depreciation, depletion and amortization
Accretion of asset retirement and environmental obligations
Loss on sale or disposal of long-lived assets, net
Total operating costs and expenses
Operating income
Interest expense, net
Other income, net
Income before income taxes
Income tax expense
Net income
Earnings per share:
Basic
Diluted
Weighted-average shares outstanding:
Basic
Diluted
$
$
$
For the three months ended June 30,
2023
2022
64,001
23
64,024
22,704
18,865
7,222
12,203
227
2,320
63,541
483
(1,392)
13,821
12,912
(5,517)
7,395
0.04
0.04
176,984,917
177,859,118
$
$
$
$
139,183
4,379
143,562
22,092
18,120
1,769
5,407
419
1
47,808
95,754
(1,326)
2,212
96,640
(23,371)
73,269
0.42
0.38
176,527,570
193,414,563
$
$
$
For the three months
ended March 31,
2023
95,666
34
95,700
24,216
19,403
8,280
8,122
227
2,490
62,738
32,962
(1,359)
13,693
45,296
(7,849)
37,447
0.21
0.20
176,881,723
193,613,539
MP MATERIALSView entire presentation