Gatos Silver Investor Presentation Deck
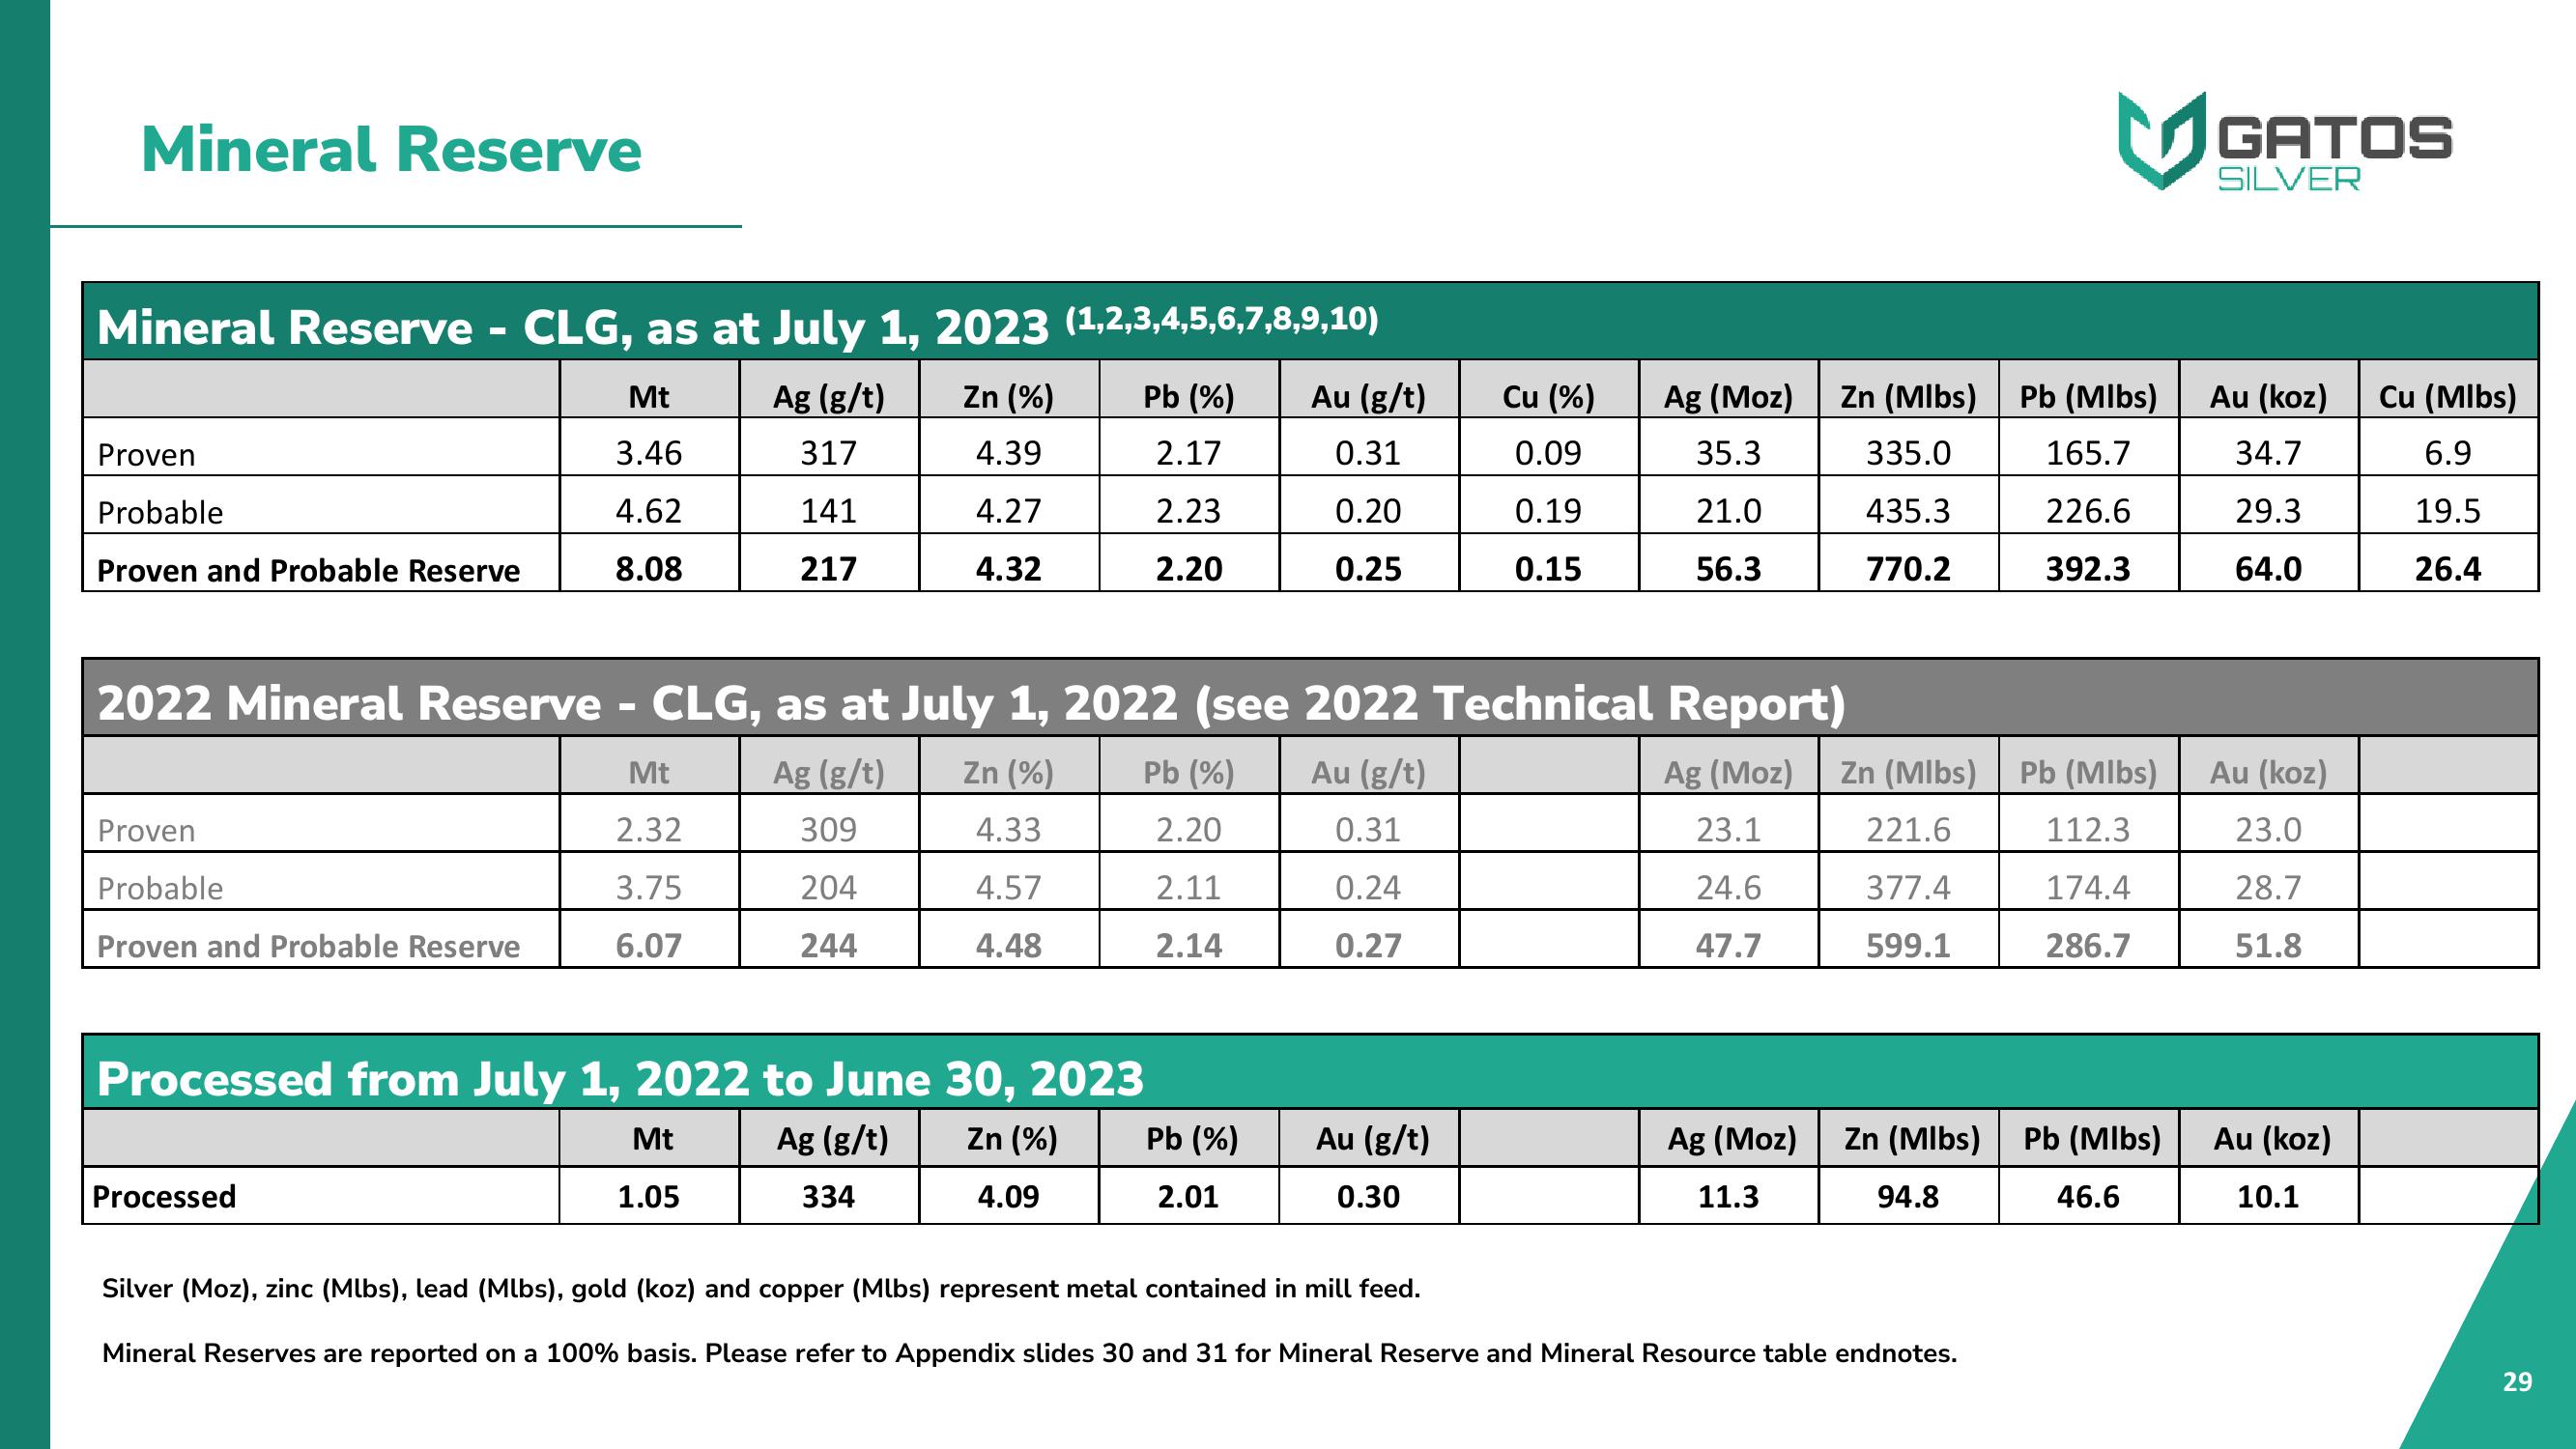
Mineral Reserve
Mineral Reserve - CLG, as at July 1, 2023 (1,2,3,4,5,6,7,8,9,10)
Zn (%)
4.39
4.27
4.32
Proven
Probable
Proven and Probable Reserve
Proven
Probable
Proven and Probable Reserve
Mt
3.46
4.62
8.08
Ag (g/t)
317
141
217
Processed
Pb (%)
2.17
2.23
2.20
Processed from July 1, 2022 to June 30, 2023
Mt
Ag (g/t)
Zn (%)
1.05
334
4.09
Au (g/t)
0.31
0.20
0.25
2022 Mineral Reserve - CLG, as at July 1, 2022 (see 2022 Technical Report)
Mt
Ag (g/t)
Zn (%)
Pb (%) Au (g/t)
Ag (Moz)
2.32
309
4.33
2.20
0.31
23.1
3.75
204
4.57
2.11
0.24
24.6
6.07
244
4.48
2.14
0.27
47.7
Pb (%)
2.01
Cu (%)
0.09
0.19
0.15
Au (g/t)
0.30
Ag (Moz)
35.3
21.0
56.3
Zn (Mlbs)
335.0
435.3
770.2
Ag (Moz)
11.3
Zn (Mlbs)
221.6
377.4
599.1
Zn (Mlbs)
94.8
Silver (Moz), zinc (Mlbs), lead (Mlbs), gold (koz) and copper (Mlbs) represent metal contained in mill feed.
Mineral Reserves are reported on a 100% basis. Please refer to Appendix slides 30 and 31 for Mineral Reserve and Mineral Resource table endnotes.
Pb (Mlbs)
165.7
226.6
392.3
Pb (Mlbs)
112.3
174.4
286.7
Pb (Mlbs)
46.6
GATOS
SILVER
Au (koz)
34.7
29.3
64.0
Au (koz)
23.0
28.7
51.8
Au (koz)
10.1
Cu (Mlbs)
6.9
19.5
26.4
29View entire presentation