Bridge Investment Group Results Presentation Deck
FEE RELATED REVENUE SUMMARY
Management Fees ($ in MM)
$32
Q4
2020
$19
$31 $35
Transaction Fees ($ in MM)
$3
$5
$41
$16
$4
Q1 Q2 Q3 Q4 Q1 Q2 Q3 Q4
2021 2021 2021 2021 2022 2022 2022 2022
All Other Fees ($ in MM)
$22
$5
$50
$8
$32
$6
$53
Q4 Q1 Q2 Q3 Q4
2020 2021 2021 2021
2021
Q4
Q1 Q2 Q3 Q4 Q1 Q2 Q3 Q4
2020 2021 2021 2021 2021 2022 2022 2022 2022
BRIDGE INVESTMENT GROUP
$22
$49
$10
$18
$64
$9
$12
$55
$5
$11
$12
I
Q3
Q4
Q1 Q2
2022 2022 2022 2022
Fee Related Revenue ($ in MM)
$88 $84
$54
$40
$56
$70
$76
$86
$73
Q4
Q1 Q2 Q3 Q4 Q1 Q2
Q3 Q4
2020 2021 2021 2021 2021 2022 2022 2022 2022
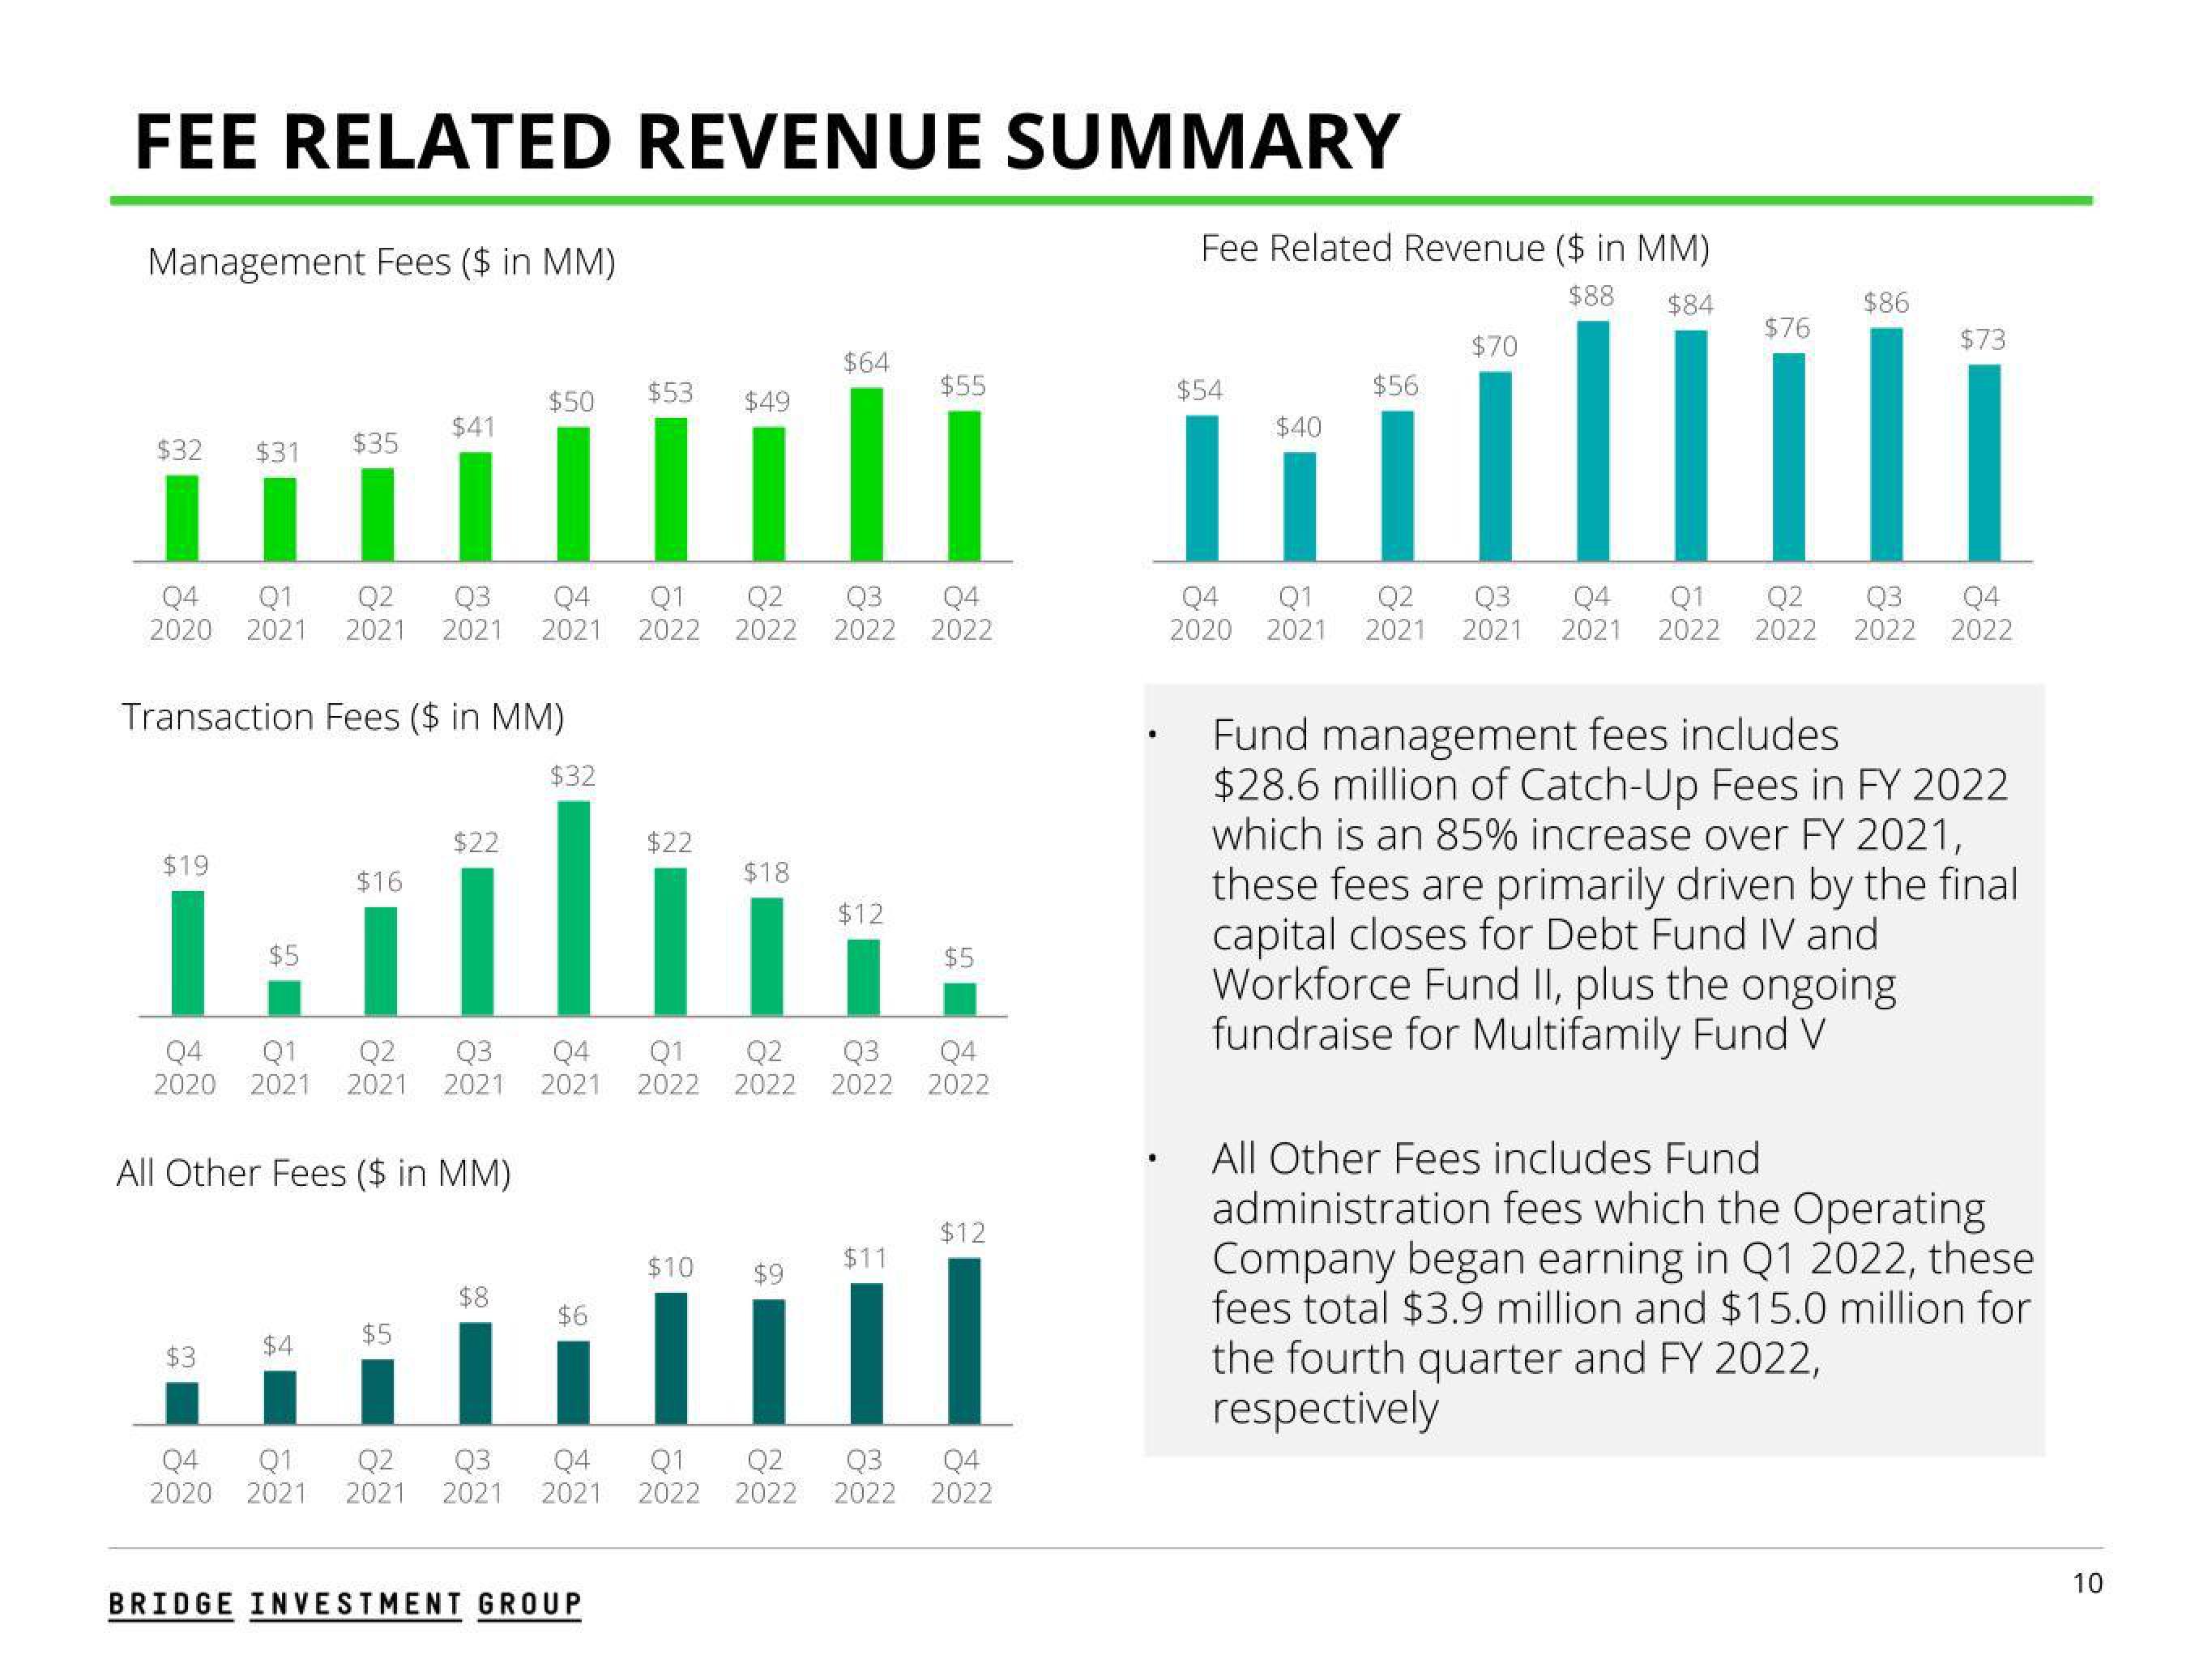
Fund management fees includes
$28.6 million of Catch-Up Fees in FY 2022
which is an 85% increase over FY 2021,
these fees are primarily driven by the final
capital closes for Debt Fund IV and
Workforce Fund II, plus the ongoing
fundraise for Multifamily Fund V
All Other Fees includes Fund
administration fees which the Operating
Company began earning in Q1 2022, these
fees total $3.9 million and $15.0 million for
the fourth quarter and FY 2022,
respectively
10View entire presentation