AG Direct Lending SMA
ANGELO
AG GORDON
The Growth of AG Direct Lending
2014 - Present
$12.3 Billion
of Asset Commitments
284
Closed Platforms
95
Realized Transactions
102
Unique Sponsors
95%
Admin and Co-Lead
Arranger
4,125
Unique Deals Reviewed
Since Inception
The above metrics are not necessarily
indicative of future activity.
Fund Status
Fund I Raise:1
Fund II Raise:1
Fund III Raise:
Fund IV Raise:1
Evergreen SMAS:
Unlevered BDC:
Committed Dollars ($mm)
Unique
Borrowers
Originators
Team Size
$824
$12,500
$10,500
$8,500
$6,500
$4,500
$2,500
$500
$(1,500) Jun. '16 Dec. '16 Jun. '17 Dec. '17 Jun. '18 Dec. '18 Jun. '19 Dec. '19 Jun. '20 Dec. '20 Jun. '21 Current
32
5
23
$700 million Equity Raised
$1.7 billion Equity Raised
$2.8 billion Equity Raised
$3.1 billion Equity Raised
$775 million Equity Raised
$216 million Equity Raised
$1,459
51
5
29
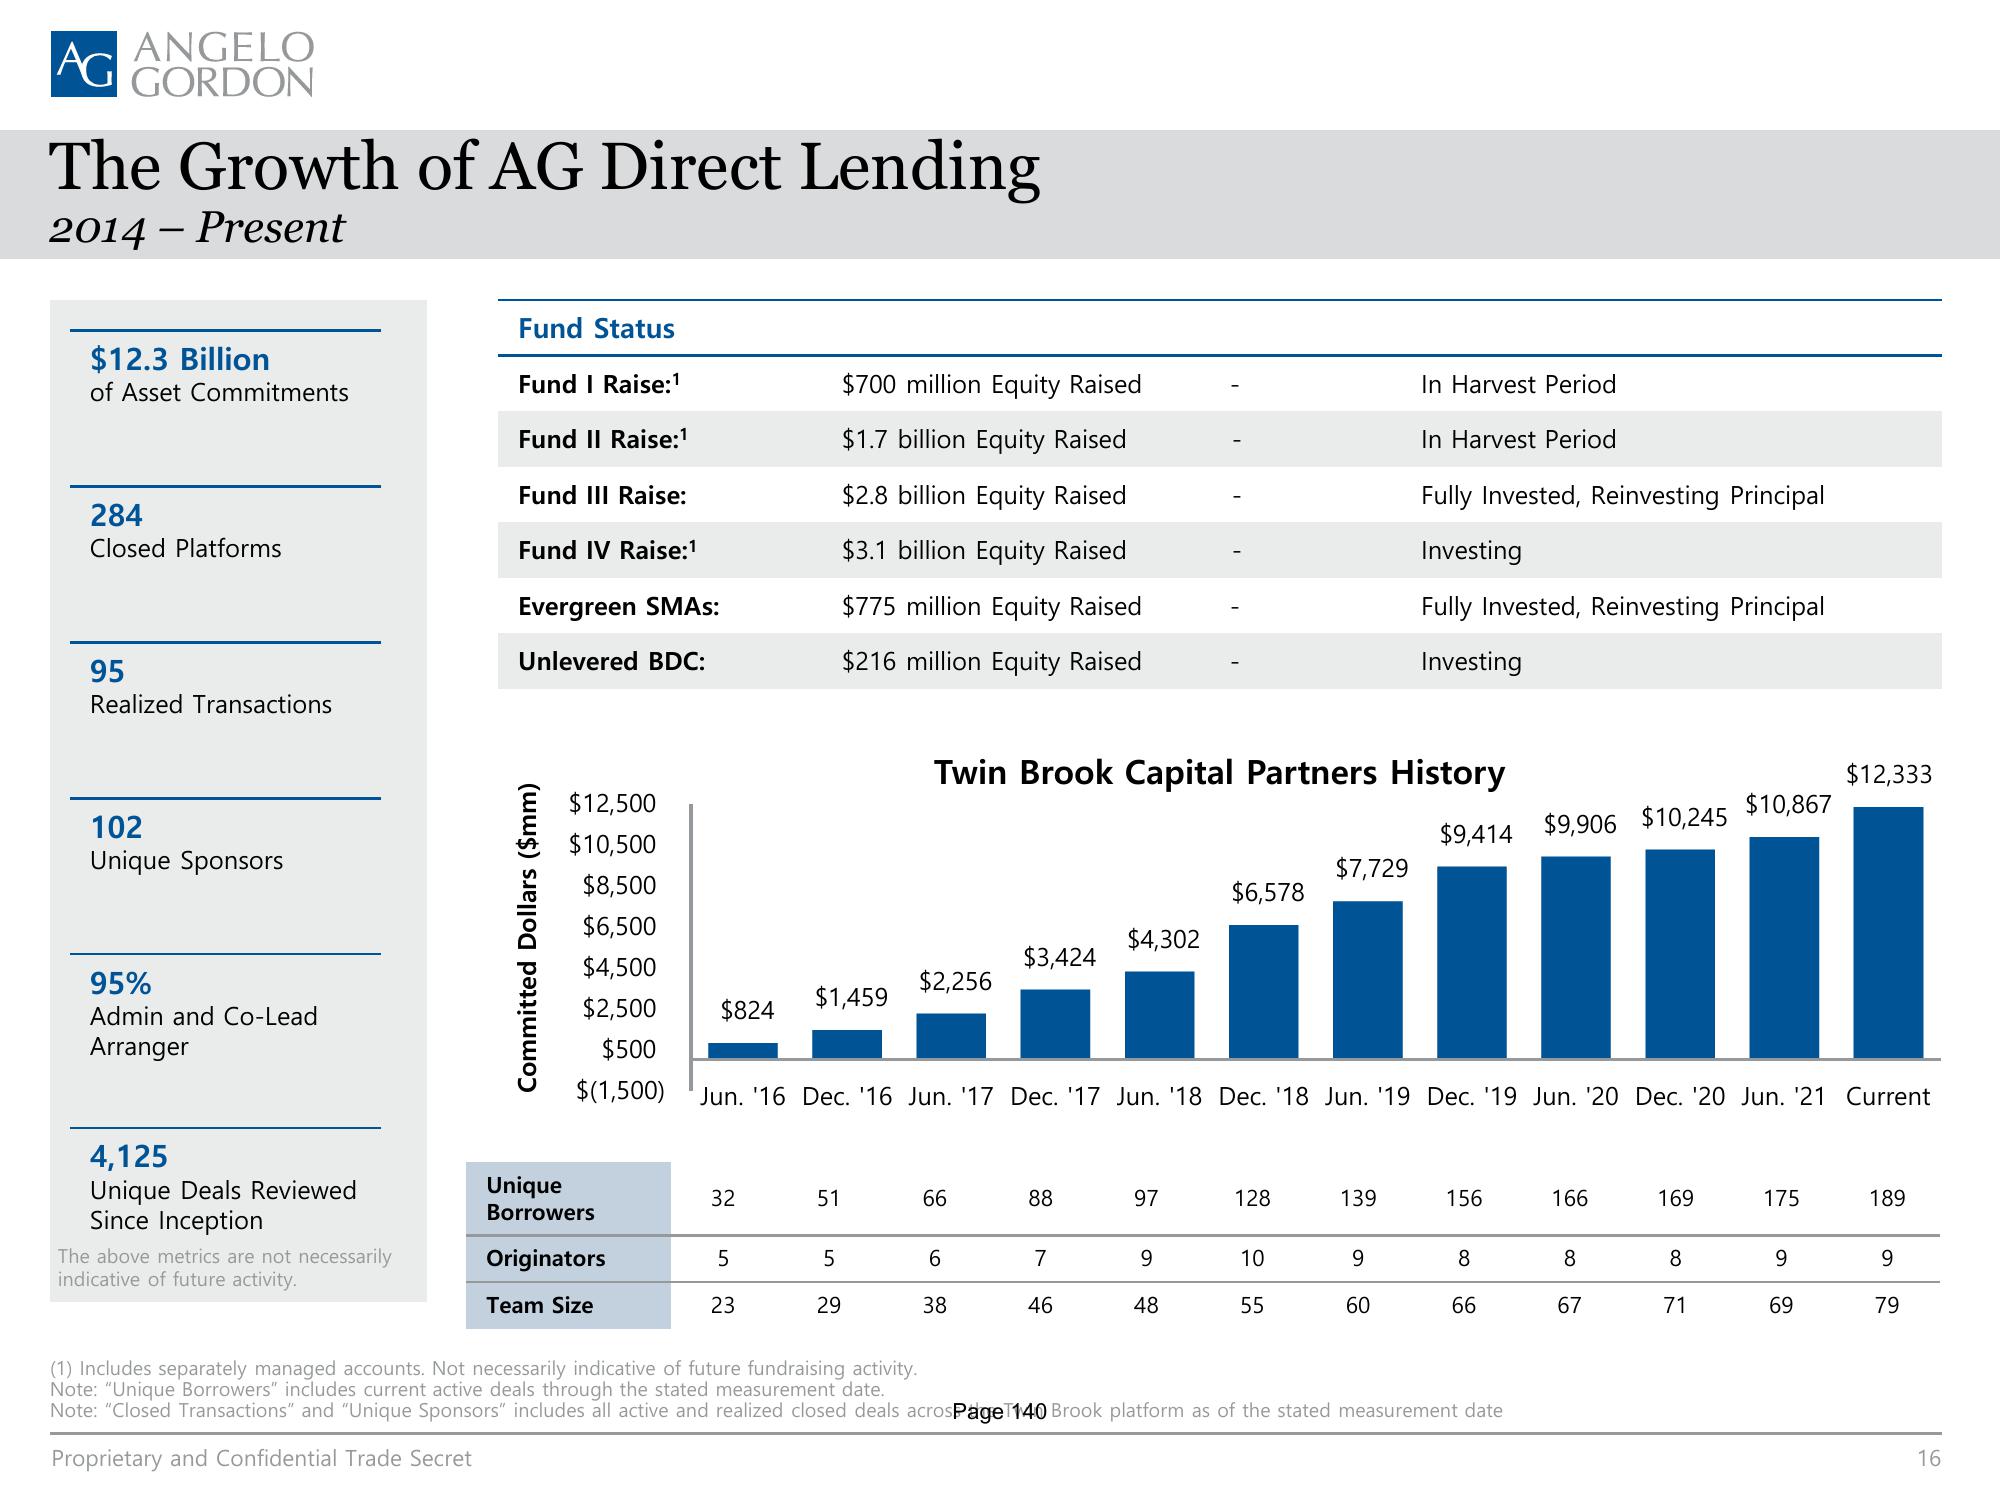
Twin Brook Capital Partners History
$2,256
66
6
38
$3,424
88
7
46
$4,302
97
9
48
$6,578
128
10
55
$7,729
In Harvest Period
In Harvest Period
Fully Invested, Reinvesting Principal
Investing
Fully Invested, Reinvesting Principal
Investing
139
9
60
$9,414 $9,906 $10,245
156
8
66
(1) Includes separately managed accounts. Not necessarily indicative of future fundraising activity.
Note: "Unique Borrowers" includes current active deals through the stated measurement date.
Note: "Closed Transactions" and "Unique Sponsors" includes all active and realized closed deals acrosPageT140 Brook platform as of the stated measurement date
Proprietary and Confidential Trade Secret
166
8
67
169
$10,867
8
71
175
$12,333
9
69
189
9
79
16View entire presentation