IBEX IPO Presentation Deck
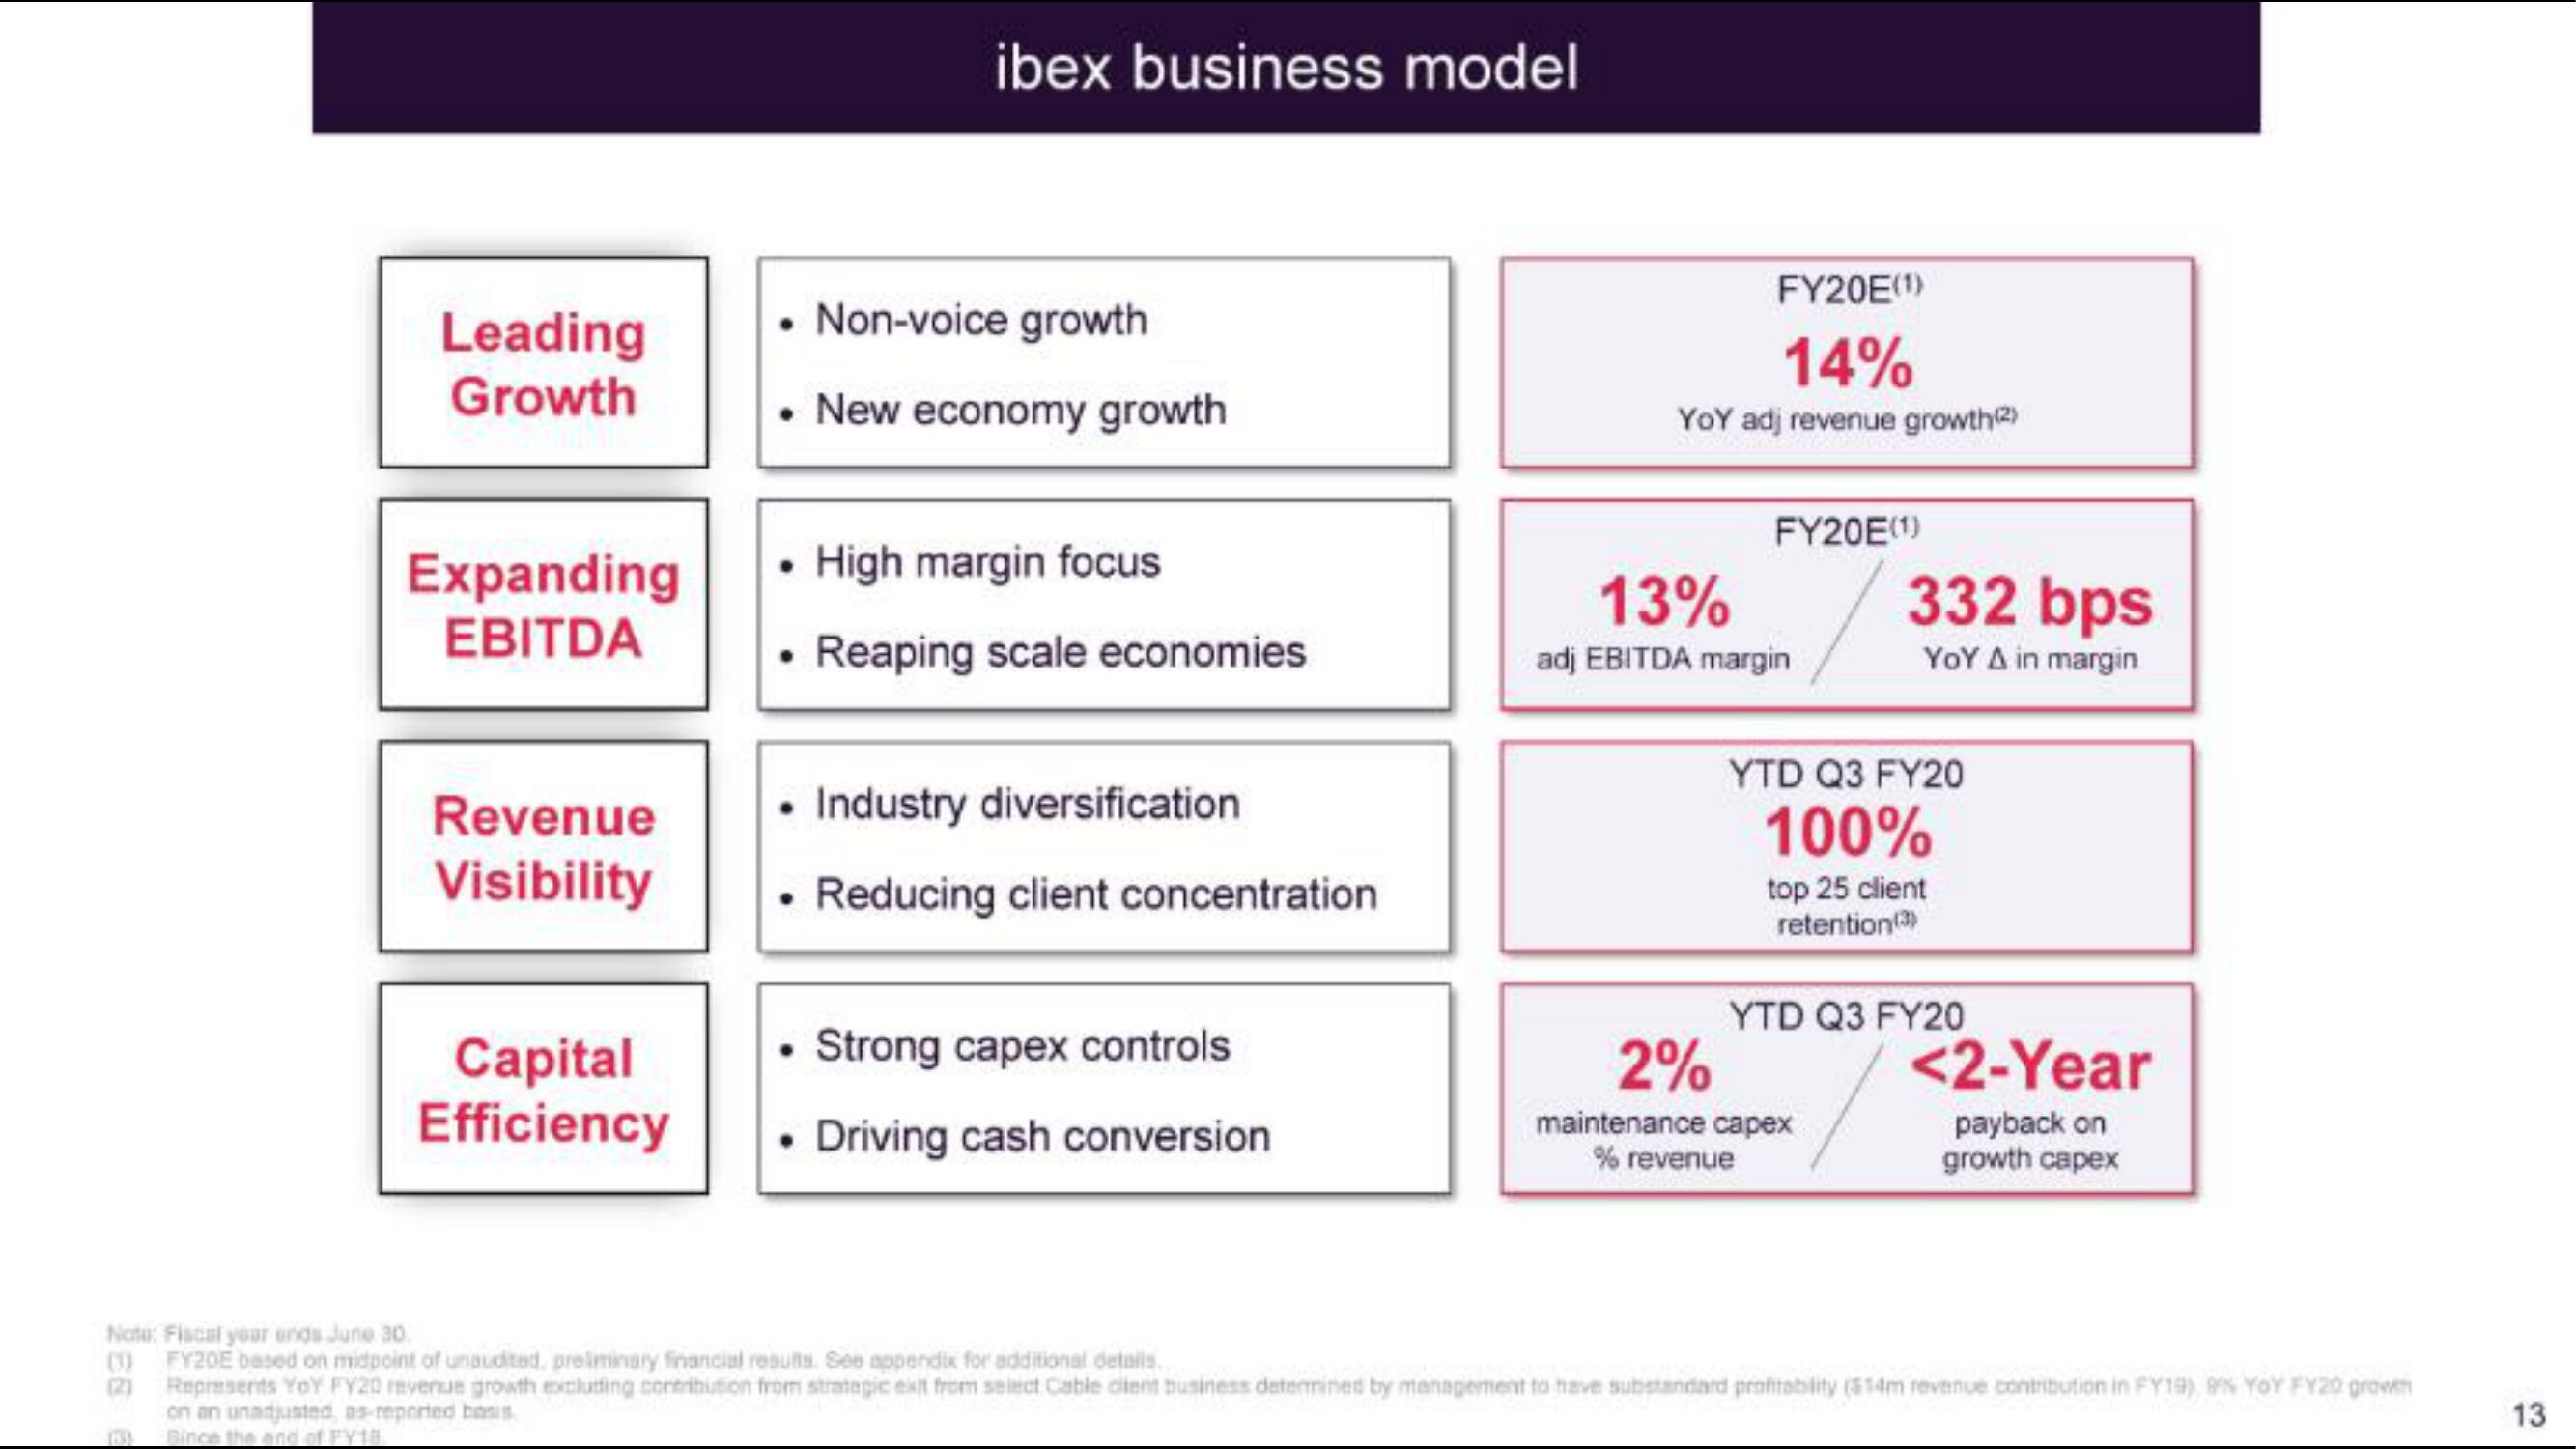
Leading
Growth
Expanding
EBITDA
Revenue
Visibility
Capital
Efficiency
ibex business model
. Non-voice growth
New economy growth
High margin focus
Reaping scale economies
Industry diversification
• Reducing client concentration
Strong capex controls
Driving cash conversion
FY20E(¹)
14%
YOY adj revenue growth(2)
FY20E(¹)
13%
adj EBITDA margin
332 bps
YOY A in margin
YTD Q3 FY20
100%
top 25 client
retention (3)
YTD Q3 FY20
2%
maintenance capex
% revenue
<2-Year
payback on
growth capex
Note: Fiscal year ends June 30.
(3) FY20E based on midpoint of unaudited, preliminary financial results. See appendix for additional details.
Represents YoY FY20 revenue growth excluding contribution from strategic exit from select Cable cilent business determined by management to have substandard profitability ($14m revenue contribution in FY19) 9% YOY FY20 grown
on an unadjusted, as-reported basis
13View entire presentation