Zegna Results Presentation Deck
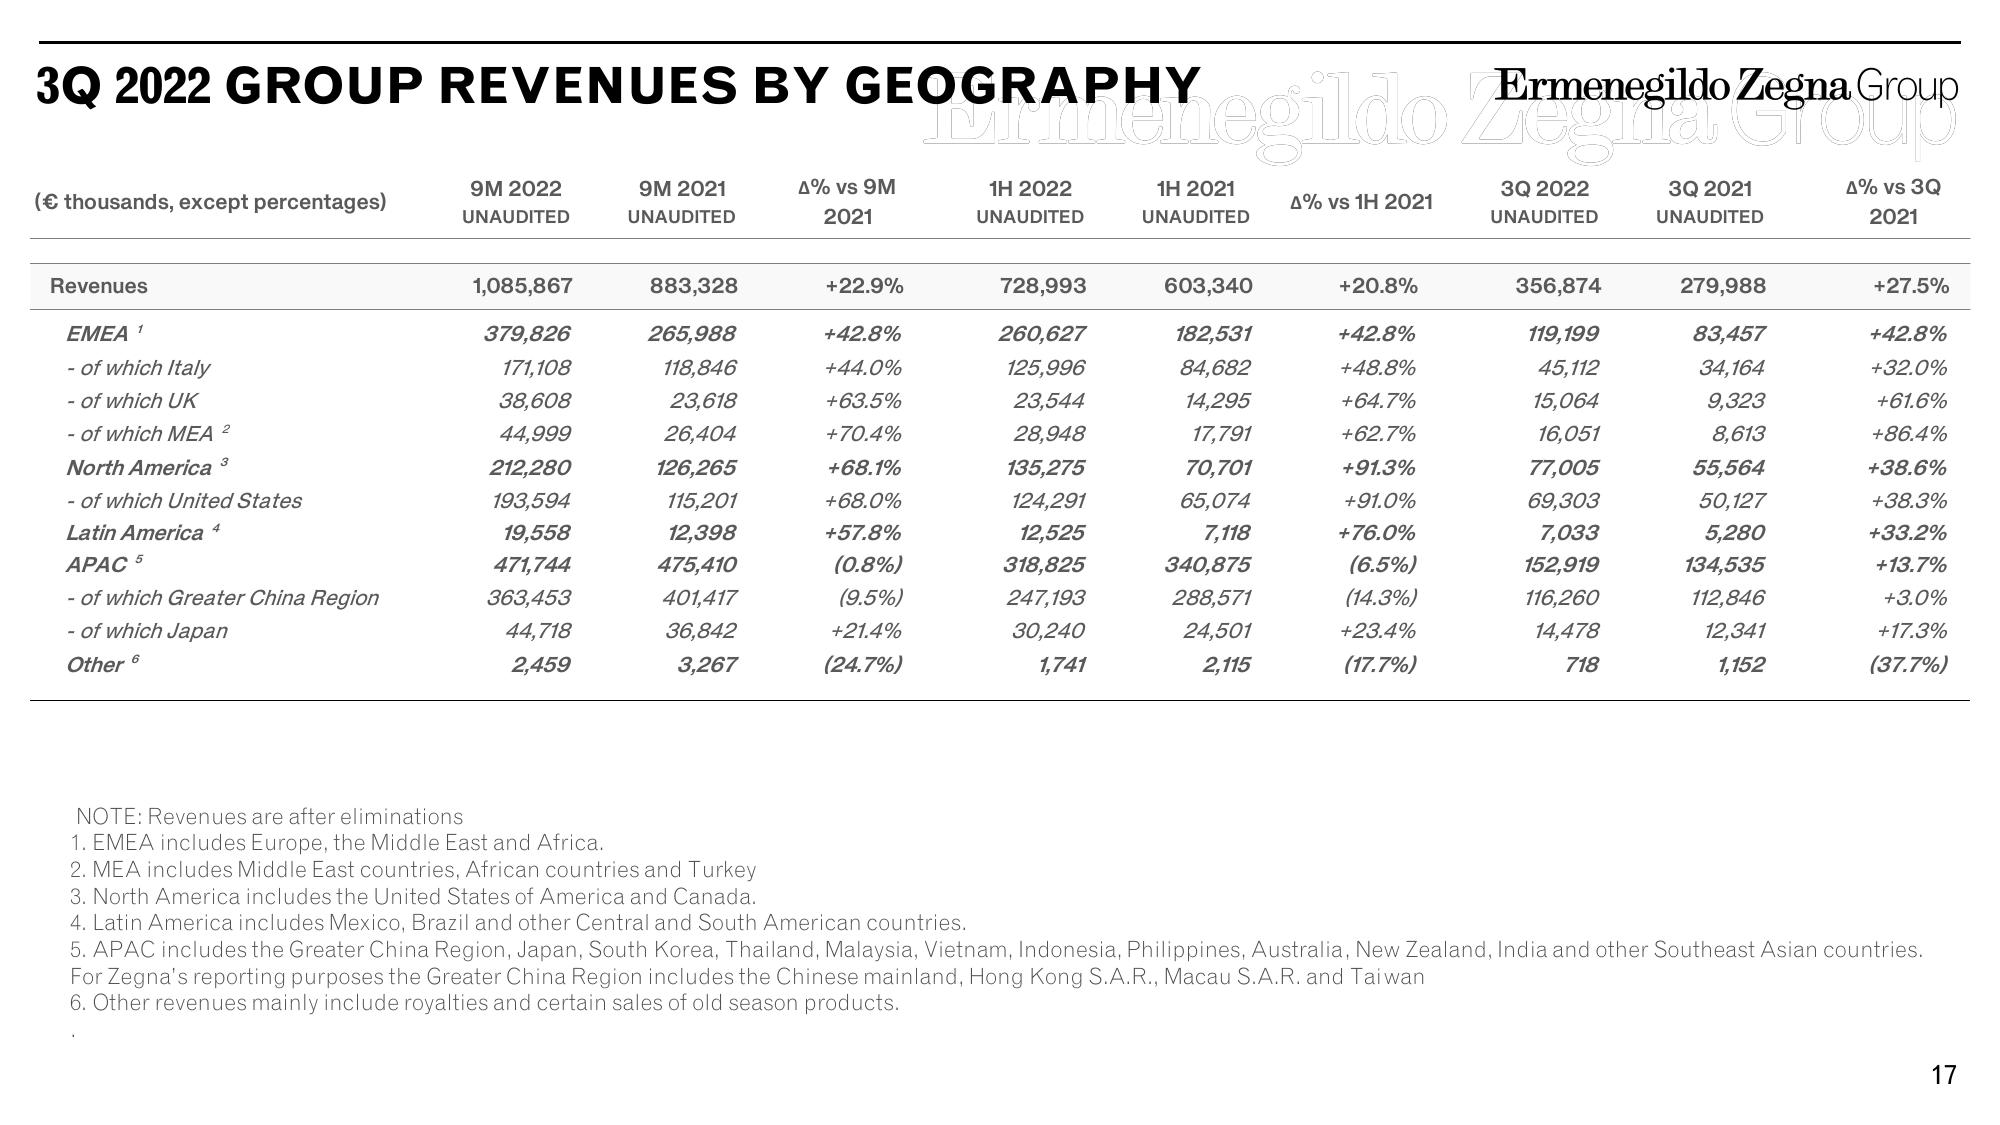
3Q 2022 GROUP REVENUES BY GEOGRAPHY
(€ thousands, except percentages)
Revenues
EMEA ¹
- of which Italy
- of which UK
- of which MEA ²
North America 3
- of which United States
Latin America 4
APAC 5
- of which Greater China Region
- of which Japan
Other 6
9M 2022
UNAUDITED
1,085,867
379,826
171,108
38,608
44,999
212,280
193,594
19,558
471,744
363,453
44,718
2,459
9M 2021
UNAUDITED
883,328
265,988
118,846
23,618
26,404
126,265
115,201
12,398
475,410
401,417
36,842
3,267
A% vs 9M
2021
+22.9%
+42.8%
+44.0%
+63.5%
+70.4%
+68.1%
+68.0%
+57.8%
(0.8%)
(9.5%)
+21.4%
(24.7%)
OGRAPHY egildo Ermenegildo Zegna Group
1H 2022
UNAUDITED
728,993
260,627
125,996
23,544
28,948
135,275
124,291
12,525
318,825
247,193
30,240
1,741
1H 2021
UNAUDITED
603,340
182,531
84,682
14,295
17,791
70,701
65,074
7,118
340,875
288,571
24,501
2,115
4% vs 1H 2021
+20.8%
+42.8%
+48.8%
+64.7%
+62.7%
+91.3%
+91.0%
+76.0%
(6.5%)
(14.3%)
+23.4%
(17.7%)
3Q 2022
UNAUDITED
356,874
119,199
45,112
15,064
16,051
77,005
69,303
7,033
152,919
116,260
14,478
718
3Q 2021
UNAUDITED
279,988
83,457
34,164
9,323
8,613
55,564
50,127
5,280
134,535
112,846
12,341
1,152
A% vs 3Q
2021
+27.5%
+42.8%
+32.0%
+61.6%
+86.4%
+38.6%
+38.3%
+33.2%
+13.7%
+3.0%
+17.3%
(37.7%)
NOTE: Revenues are after eliminations
1. EMEA includes Europe, the Middle East and Africa.
2. MEA includes Middle East countries, African countries and Turkey
3. North America includes the United States of America and Canada.
4. Latin America includes Mexico, Brazil and other Central and South American countries.
5. APAC includes the Greater China Region, Japan, South Korea, Thailand, Malaysia, Vietnam, Indonesia, Philippines, Australia, New Zealand, India and other Southeast Asian countries.
For Zegna's reporting purposes the Greater China Region includes the Chinese mainland, Hong Kong S.A.R., Macau S.A.R. and Taiwan
6. Other revenues mainly include royalties and certain sales of old season products.
17View entire presentation