Ford Investor Conference Presentation Deck
Company
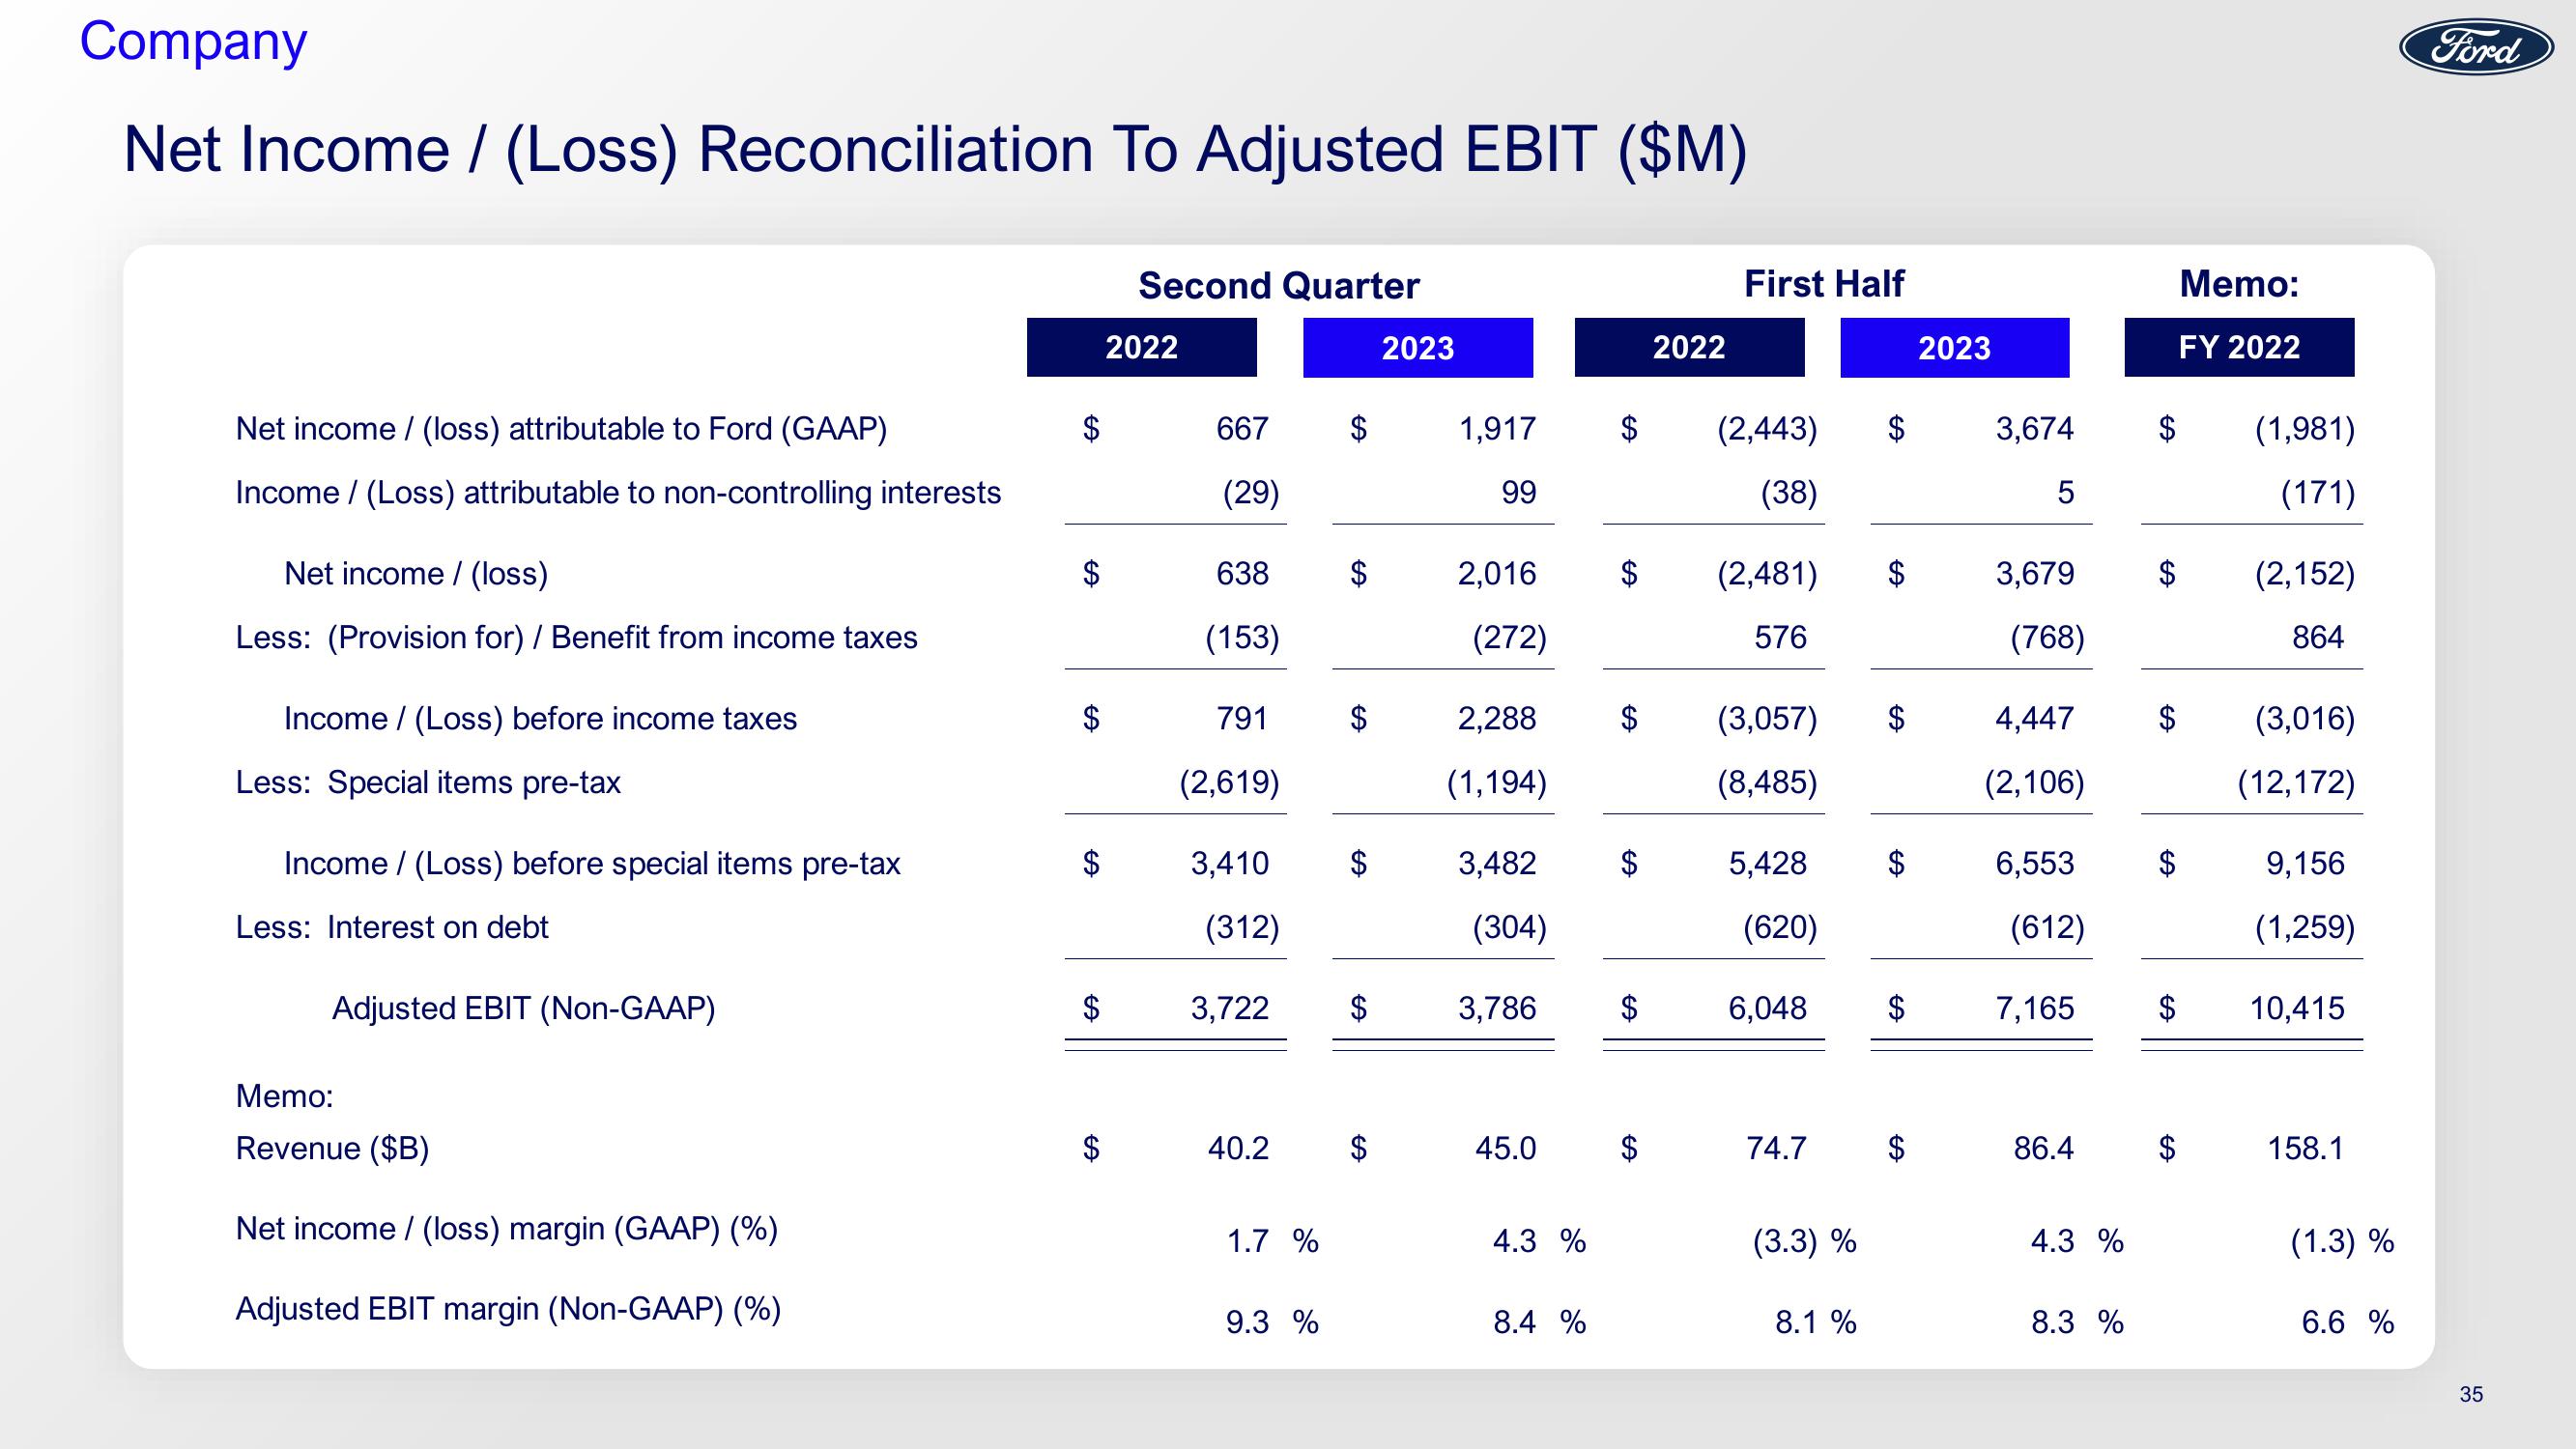
Net Income / (Loss) Reconciliation To Adjusted EBIT ($M)
Net income / (loss) attributable to Ford (GAAP)
Income / (Loss) attributable to non-controlling interests
Net income / (loss)
Less: (Provision for) / Benefit from income taxes
Income / (Loss) before income taxes
Less: Special items pre-tax
Income (Loss) before special items pre-tax
Less: Interest on debt
Adjusted EBIT (Non-GAAP)
Memo:
Revenue ($B)
Net income / (loss) margin (GAAP) (%)
Adjusted EBIT margin (Non-GAAP) (%)
$
$
$
$
Second Quarter
2022
667
(29)
638
(153)
791
(2,619)
3,410
(312)
3,722
40.2
1.7 %
9.3 %
$
$
$
$
2023
1,917
99
2,016
(272)
2,288
(1,194)
3,482
(304)
3,786
45.0
4.3 %
8.4 %
$
$
$
$
2022
First Half
(2,443)
(38)
(2,481)
576
(3,057) $
(8,485)
5,428
(620)
6,048
74.7
(3.3) %
$
8.1 %
$
$
2023
3,674
5
3,679
(768)
4,447
(2,106)
6,553
(612)
7,165
86.4
4.3 %
8.3 %
$ (1,981)
(171)
$
$
$
$
Memo:
FY 2022
$
(2,152)
864
(3,016)
(12,172)
9,156
(1,259)
10,415
158.1
(1.3) %
6.6 %
Ford
35View entire presentation