Liberty Global Results Presentation Deck
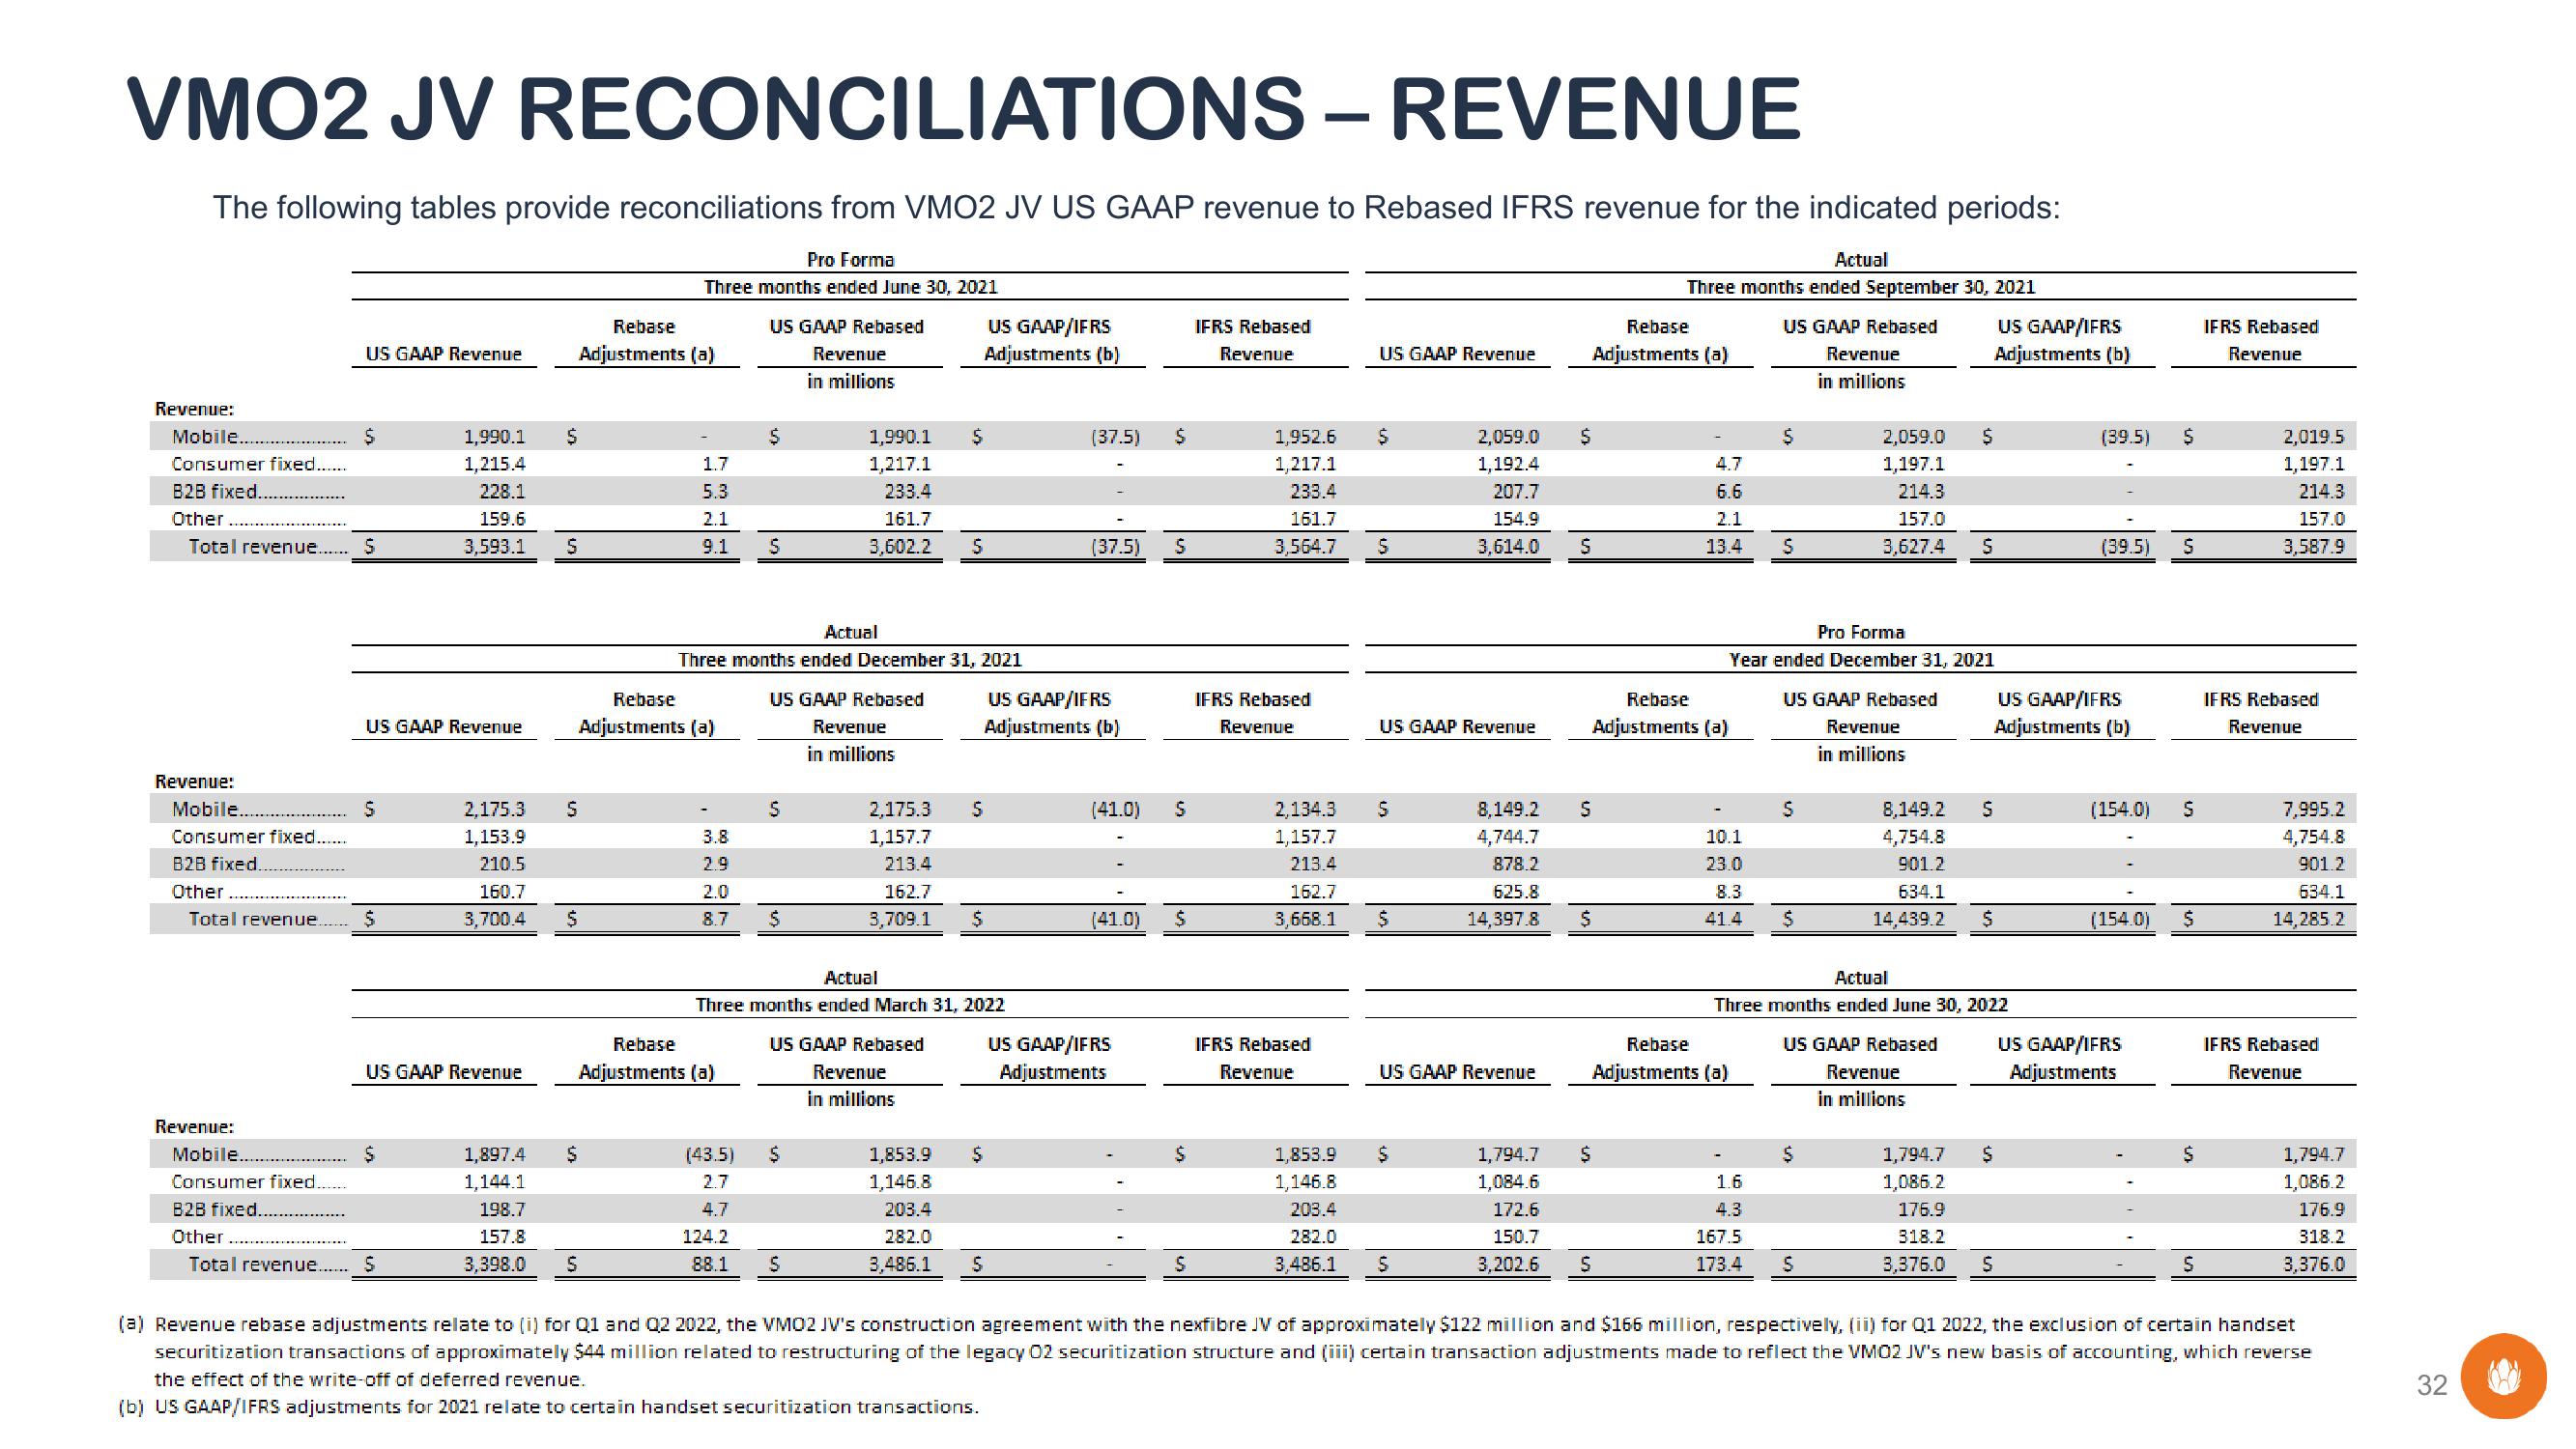
VMO2 JV RECONCILIATIONS - REVENUE
The following tables provide reconciliations from VMO2 JV US GAAP revenue to Rebased IFRS revenue for the indicated periods:
Actual
Three months ended September 30, 2021
US GAAP Rebased
Revenue
in millions
Revenue:
Mobile.
Consumer fixed......
Revenue:
B2B fixed.
Other
Total revenue...... S
Mobile....
Consumer fixed......
B2B fixed.
Other
Total revenue......
Revenue:
Mobile..
Consumer fixed..
B2B fixed.
Other
US GAAP Revenue
Total revenue......
$
US GAAP Revenue
S
$
1,990.1
1,215.4
228.1
159.6
3,593.1
$
US GAAP Revenue
S
$
2,175.3 S
1,153.9
210.5
160.7
3,700.4
S
$
1,897.4 $
1,144.1
198.7
157.8
3,398.0
S
Pro Forma
Three months ended June 30, 2021
Rebase
Adjustments (a)
1.7
5.3
2.1
9.1
Rebase
Adjustments (a)
3.8
2.0
8.7
US GAAP Rebased
Revenue
in millions
Rebase
Adjustments (a)
$
Actual
Three months ended December 31, 2021
US GAAP Rebased
Revenue
in millions
(43.5)
2.7
4.7
S
S
$
1,990.1
1,217.1
233.4
161.7
3,602.2 $
$
$
US GAAP Rebased
Revenue
in millions
124.2
88.1 S
Actual
Three months ended March 31, 2022
2,175.3
1,157.7
213.4
162.7
3,709.1 $
US GAAP/IFRS
Adjustments (b)
S
1,853.9
1,146.8
203.4
282.0
3,486.1 S
$
US GAAP/IFRS
Adjustments (b)
(37.5)
(37.5)
(41.0)
Ś
(41.0) $
US GAAP/IFRS
Adjustments
S
$
$
S
IFRS Rebased
Revenue
1,952.6
1,217.1
233.4
161.7
3,564.7
IFRS Rebased
Revenue
2,134.3
1,157.7
213.4
162.7
3,668.1
IFRS Rebased
Revenue
1,853.9
1,146.8
203.4
282.0
3,486.1
US GAAP Revenue
$
S
US GAAP Revenue
S
$
2,059.0
1,192.4
207.7
154.9
3,614.0
$
US GAAP Revenue
S
8,149.2
4,744.7
878.2
625.8
14,397.8
$
S
S
$
$
1,794.7
1,084.6
172.6
150.7
3,202.6 S
Rebase
Adjustments (a)
4.7
6.6
2.1
13.4
Rebase
Adjustments (a)
10.1
23.0
8.3
41.4
$
S
Rebase
Adjustments (a)
Pro Forma
Year ended December 31, 2021
US GAAP Rebased
Revenue
in millions
S
$
2,059.0
1,197.1
214.3
157.0
3,627.4
$
8,149.2
4,754.8
901.2
634.1
14,439.2
US GAAP Rebased
Revenue
in millions
1.6
4.3
167.5
173.4 S
US GAAP/IFRS
Adjustments (b)
$
S
Actual
Three months ended June 30, 2022
S
$
1,794.7
1,086.2
176.9
318.2
3,376.0 S
$
(39.5) $
(39.5)
US GAAP/IFRS
Adjustments (b)
(154.0)
(154.0)
US GAAP/IFRS
Adjustments
S
S
$
$
S
IFRS Rebased
Revenue
2,019.5
1,197.1
214.3
157.0
3,587.9
IFRS Rebased
Revenue
7,995.2
4,754.8
901.2
634.1
14,285.2
IFRS Rebased
Revenue
1,794.7
1,086.2
176.9
318.2
3,376.0
(a) Revenue rebase adjustments relate to (i) for Q1 and Q2 2022, the VM02 JV's construction agreement with the nexfibre JV of approximately $122 million and $166 million, respectively, (ii) for Q1 2022, the exclusion of certain handset
securitization transactions of approximately $44 million related to restructuring of the legacy 02 securitization structure and (iii) certain transaction adjustments made to reflect the VM02 JV's new basis of accounting, which reverse
the effect of the write-off of deferred revenue.
(b) US GAAP/IFRS adjustments for 2021 relate to certain handset securitization transactions.
32View entire presentation