2nd Quarter 2021 Investor Presentation
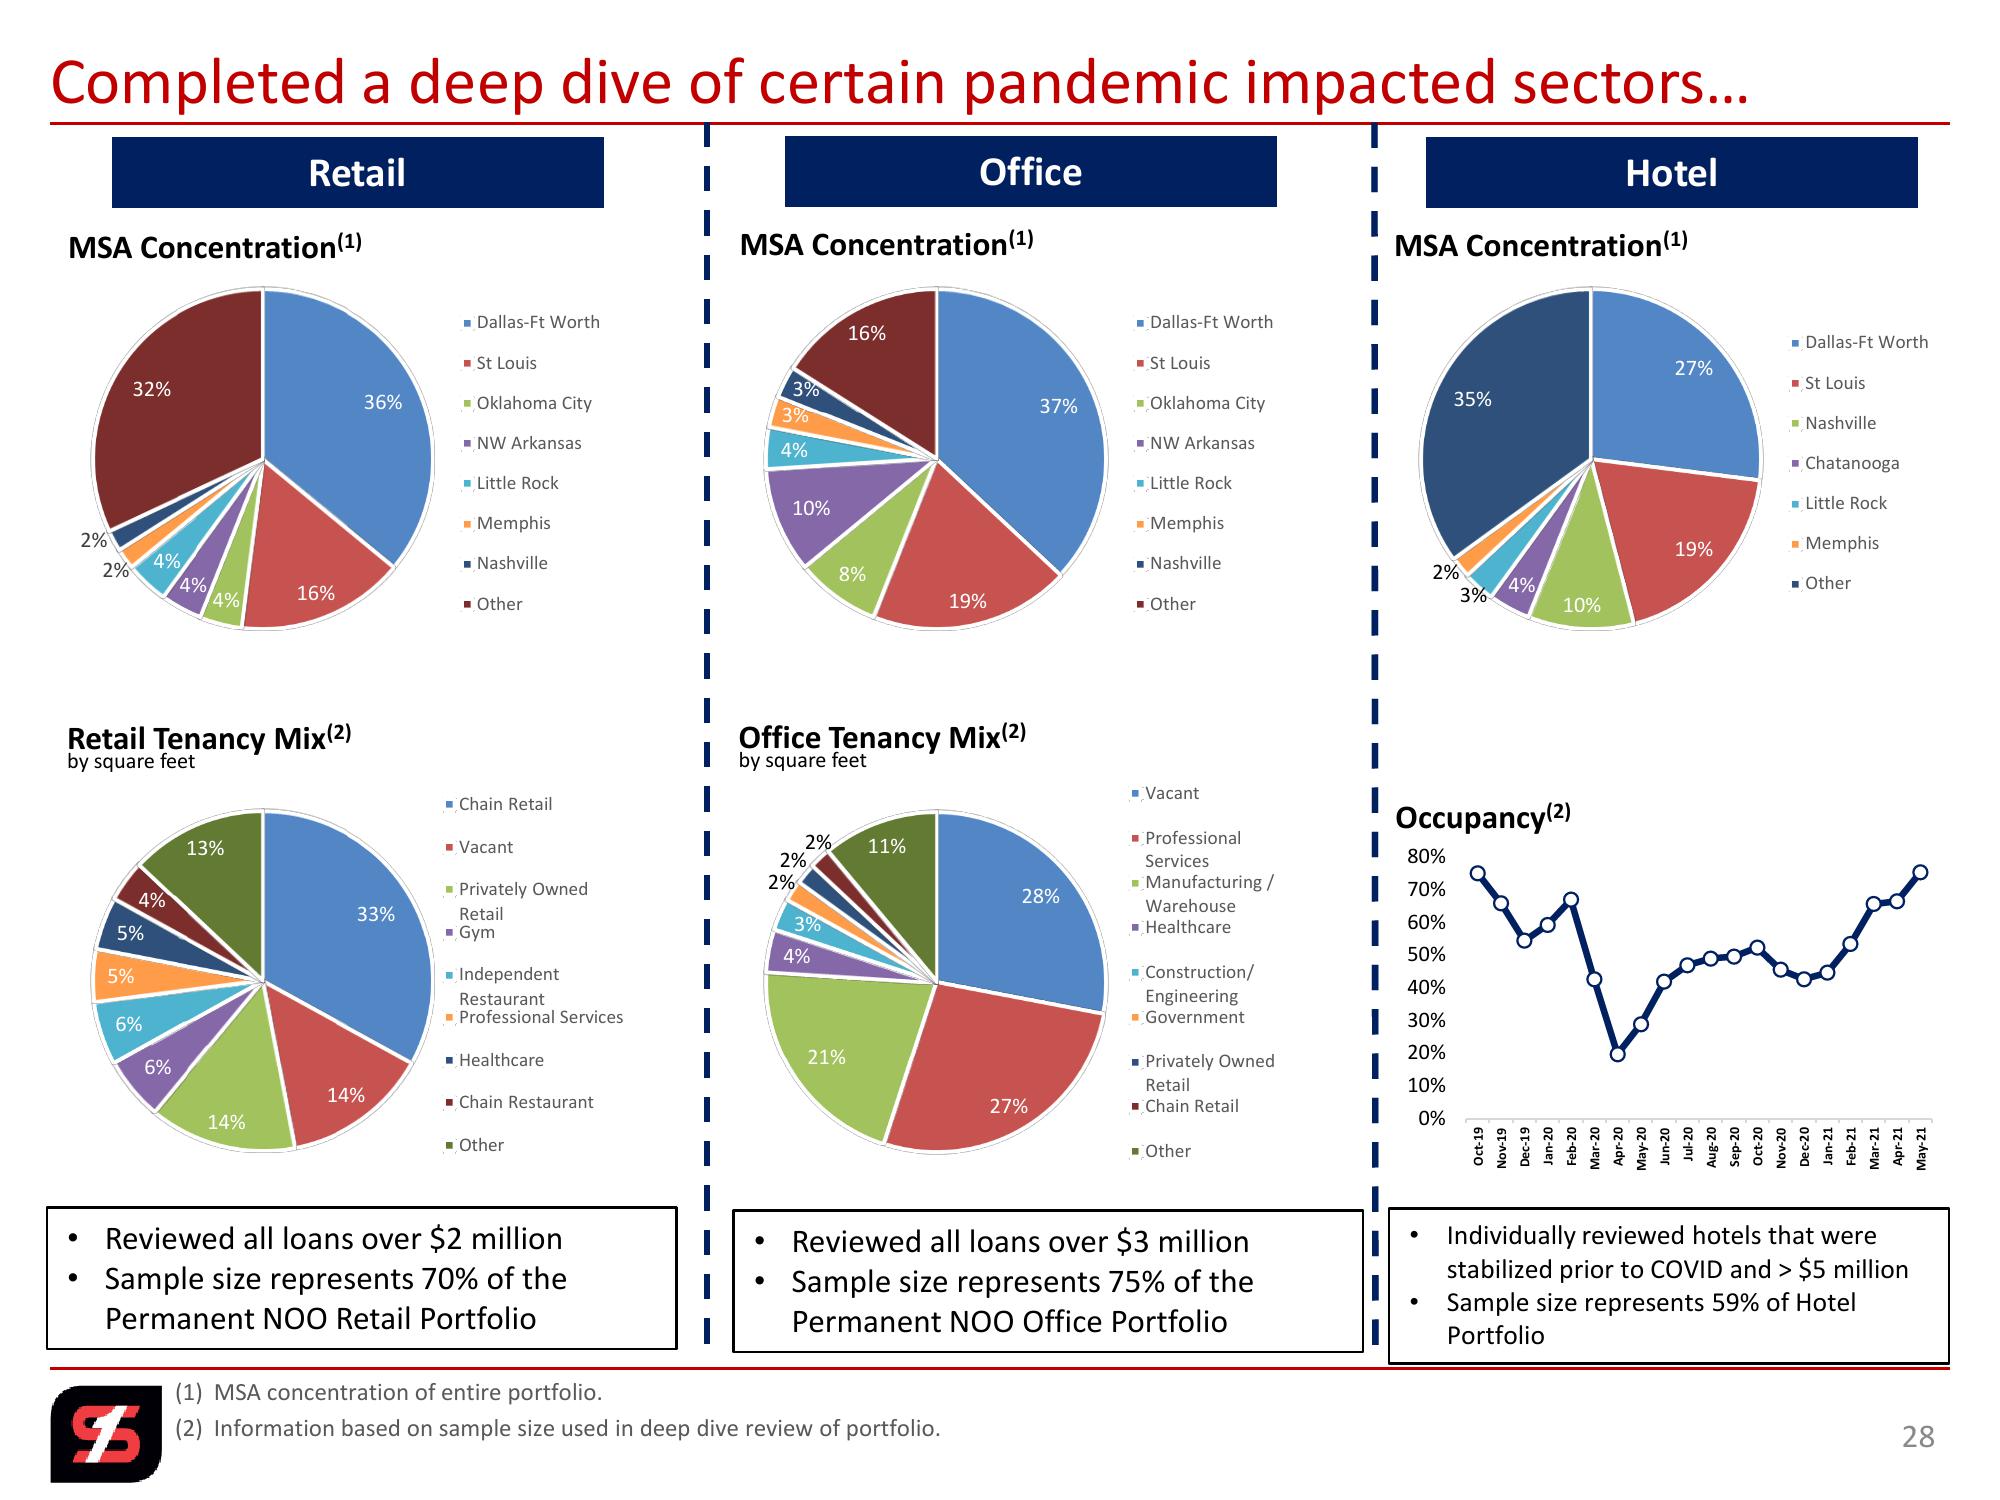
Completed a deep dive of certain pandemic impacted sectors...
Retail
MSA Concentration (1)
Office
MSA Concentration (1)
Hotel
MSA Concentration (1)
2%
Dallas-Ft Worth
■ St Louis
3%
32%
36%
Oklahoma City
3%
NW Arkansas
4%
■Little Rock
4%
2%
4% 4%
16%
Retail Tenancy Mix(2)
by square feet
■Memphis
■Nashville
Other
|
10%
16%
■Dallas-Ft Worth
■ St Louis
27%
37%
Oklahoma City
35%
■NW Arkansas
Little Rock
Memphis
■ Nashville
2%
8%
4%
3%
19%
Other
10%
Office Tenancy Mix(2)
by square feet
■Chain Retail
2%
13%
■ Vacant
11%
2%
Privately Owned
2%
28%
4%
33%
Retail
3%
5%
■Gym
4%
5%
■ Independent
Restaurant
Professional Services
6%
■ Healthcare
21%
6%
14%
Chain Restaurant
14%
■ Other
|
■ Vacant
Occupancy (2)
■ Professional
Services
|
80%
■Manufacturing /
70%
Warehouse
Healthcare
60%
|
50%
■ Construction/
Engineering
■Government
40%
| 30%
Privately Owned
20%
27%
Retail
Chain Retail
■ Other
10%
0%
Oct-19
Nov-19
Dec-19
Jan-20
Feb-20
Mar-20
Apr-20
May-20
•
Reviewed all loans over $2 million
Sample size represents 70% of the
Permanent NOO Retail Portfolio
F
(1) MSA concentration of entire portfolio.
Reviewed all loans over $3 million
Sample size represents 75% of the
Permanent NOO Office Portfolio
(2) Information based on sample size used in deep dive review of portfolio.
•
•
07-unr
19%
Dallas-Ft Worth
■ St Louis
Nashville
■ Chatanooga
■Little Rock
■Memphis
■ Other
Aug-20
Sep-20
Oct-20
Nov-20
Dec-20
Jan-21
Feb-21
Mar-21
Apr-21
May-21
Individually reviewed hotels that were
stabilized prior to COVID and > $5 million
Sample size represents 59% of Hotel
Portfolio
28View entire presentation