Ciena Corporation Earnings Presentation
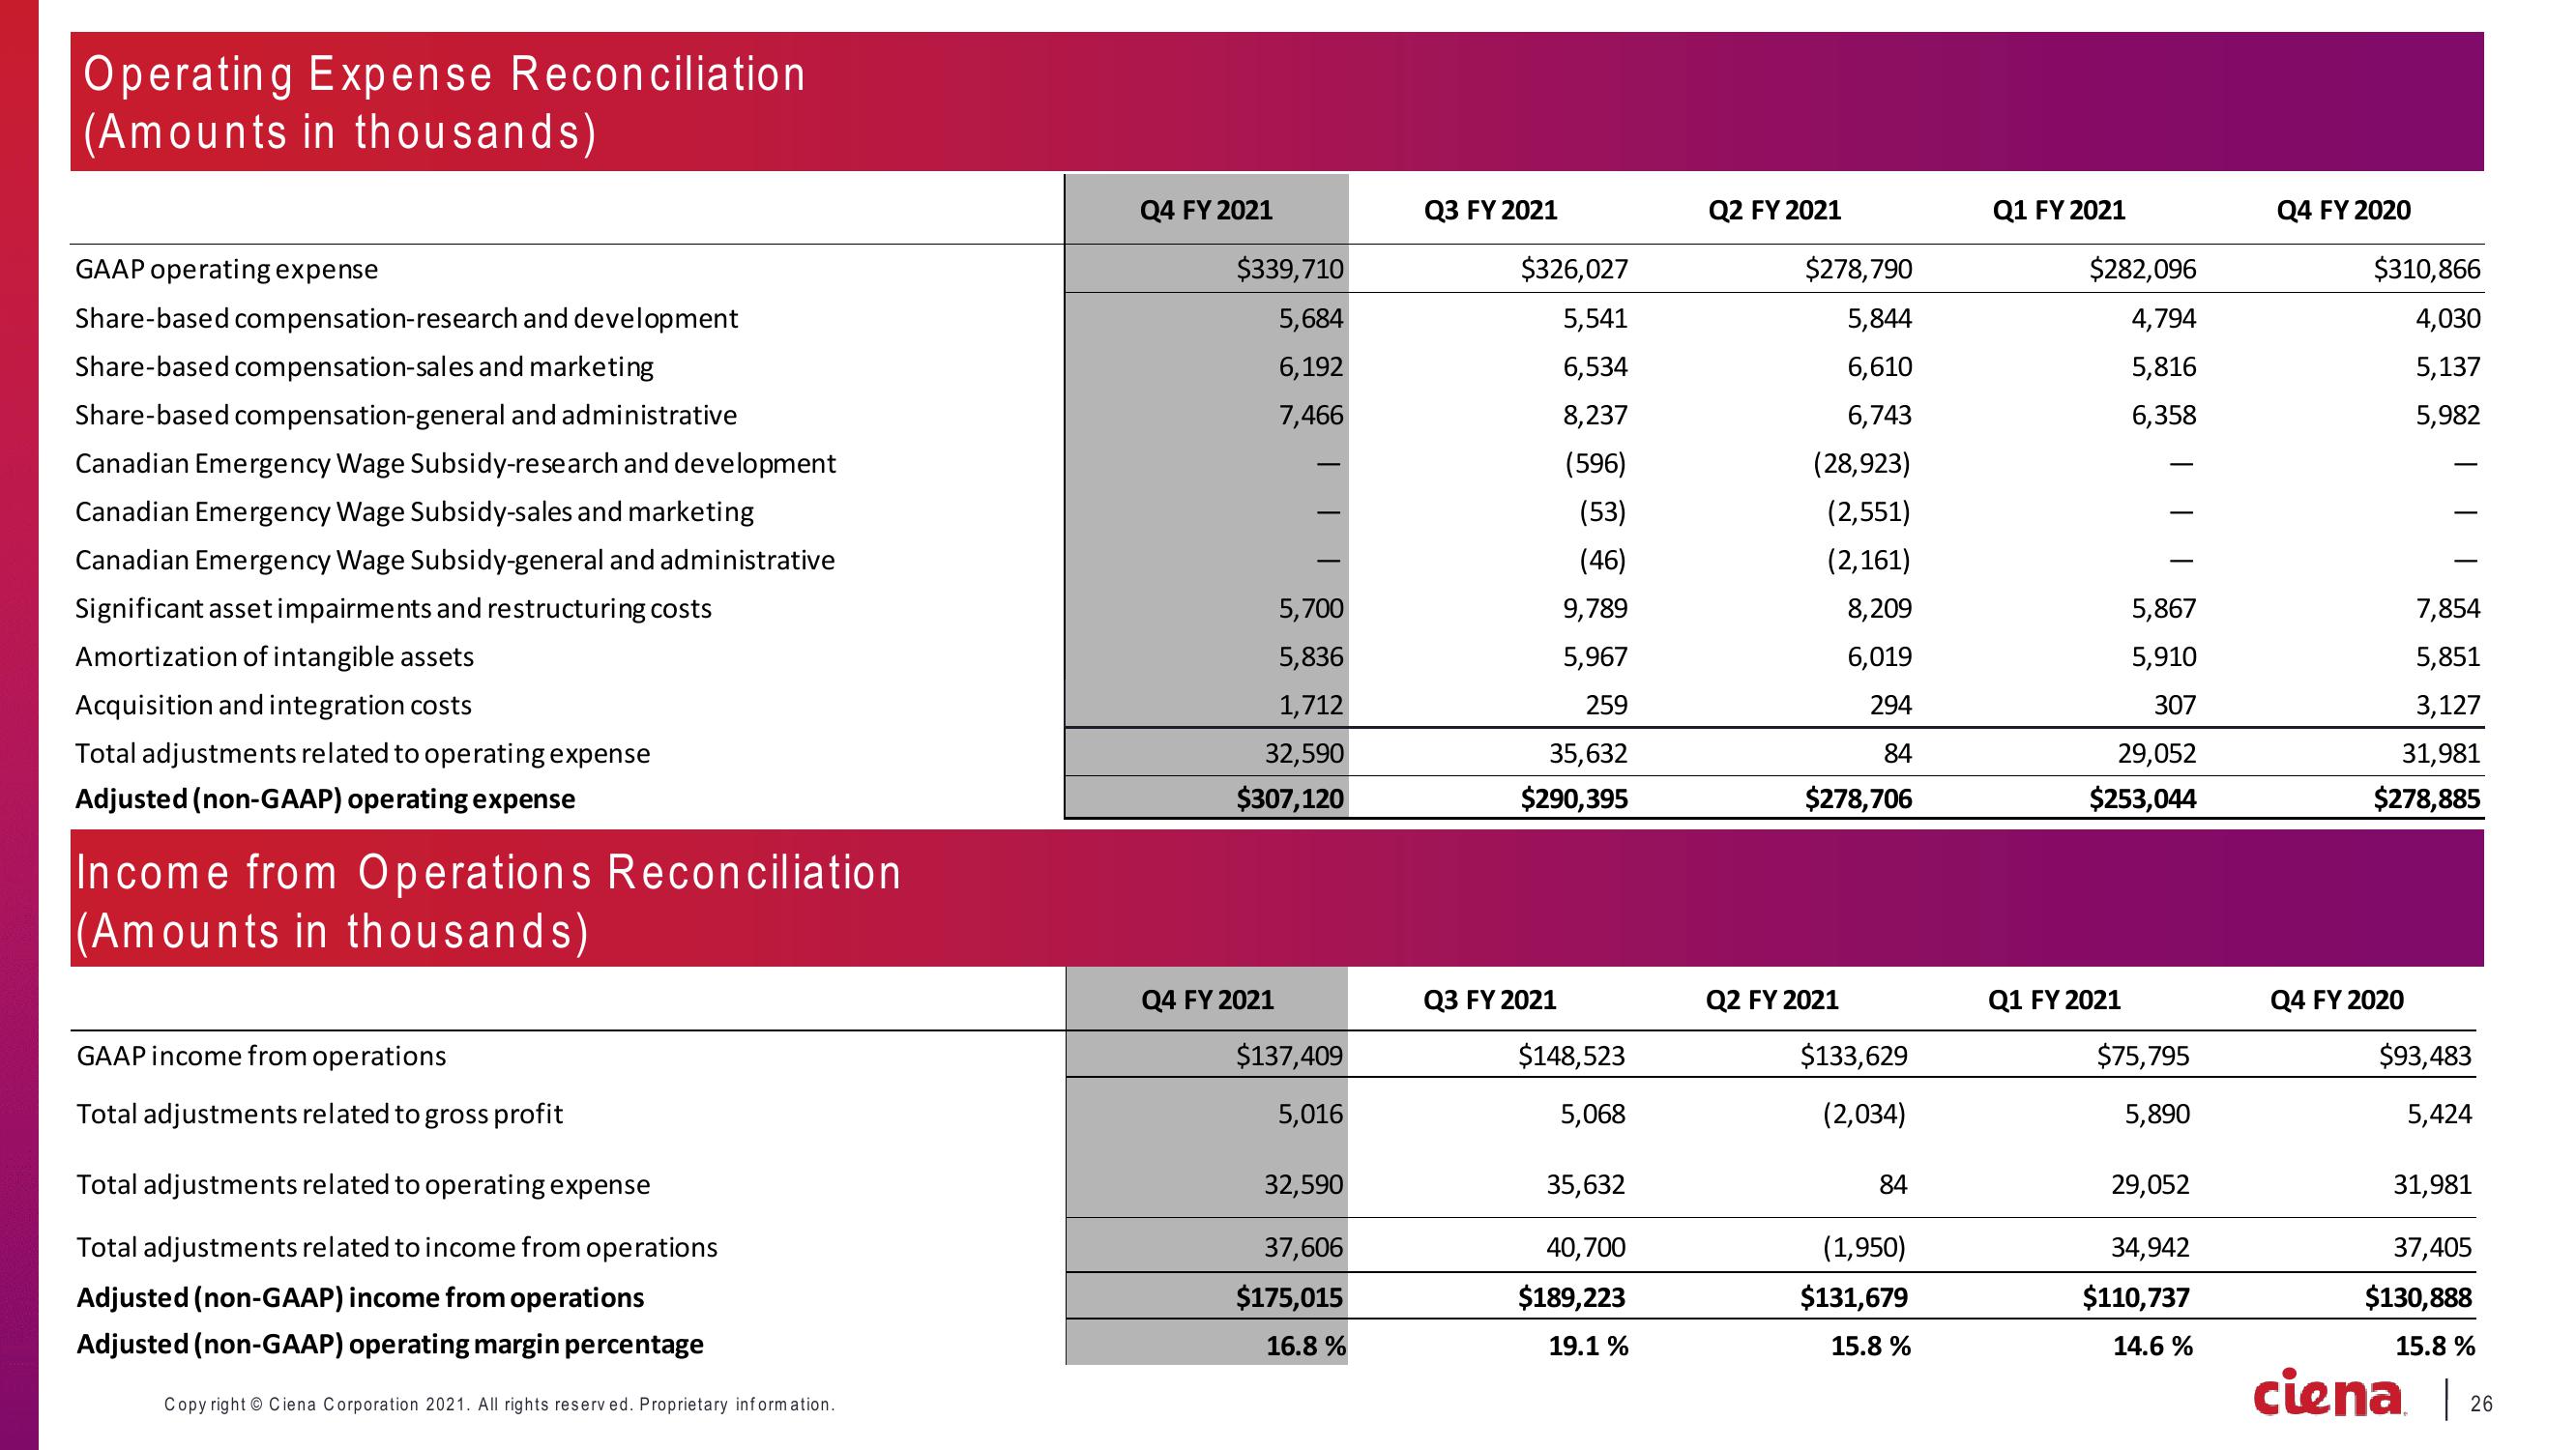
Operating Expense Reconciliation
(Amounts in thousands)
GAAP operating expense
Share-based compensation-research and development
Share-based compensation-sales and marketing
Share-based compensation-general and administrative
Canadian Emergency Wage Subsidy-research and development
Canadian Emergency Wage Subsidy-sales and marketing
Canadian Emergency Wage Subsidy-general and administrative
Significant asset impairments and restructuring costs
Amortization of intangible assets
Acquisition and integration costs
Total adjustments related to operating expense
Adjusted (non-GAAP) operating expense
Income from Operations Reconciliation
(Amounts in thousands)
GAAP income from operations
Total adjustments related to gross profit
Total adjustments related to operating expense
Total adjustments related to income from operations
Adjusted (non-GAAP) income from operations
Adjusted (non-GAAP) operating margin percentage
Copyright © Ciena Corporation 2021. All rights reserved. Proprietary information.
Q4 FY 2021
$339,710
5,684
6,192
7,466
5,700
5,836
1,712
32,590
$307, 120
Q4 FY 2021
$137,409
5,016
32,590
37,606
$175,015
16.8 %
Q3 FY 2021
$326,027
5,541
6,534
8,237
(596)
(53)
(46)
9,789
5,967
259
35,632
$290,395
Q3 FY 2021
$148,523
5,068
35,632
40,700
$189,223
19.1 %
Q2 FY 2021
$278,790
5,844
6,610
6,743
(28,923)
(2,551)
(2,161)
8,209
6,019
294
84
$278,706
Q2 FY 2021
$133,629
(2,034)
84
(1,950)
$131,679
15.8 %
Q1 FY 2021
$282,096
4,794
5,816
6,358
5,867
5,910
307
29,052
$253,044
Q1 FY 2021
$75,795
5,890
29,052
34,942
$110,737
14.6 %
Q4 FY 2020
$310,866
4,030
5,137
5,982
7,854
5,851
3,127
31,981
$278,885
Q4 FY 2020
$93,483
5,424
31,981
37,405
$130,888
15.8 %
ciena |
26View entire presentation