Newsight Imaging SPAC Presentation Deck
Revenue
Multiple
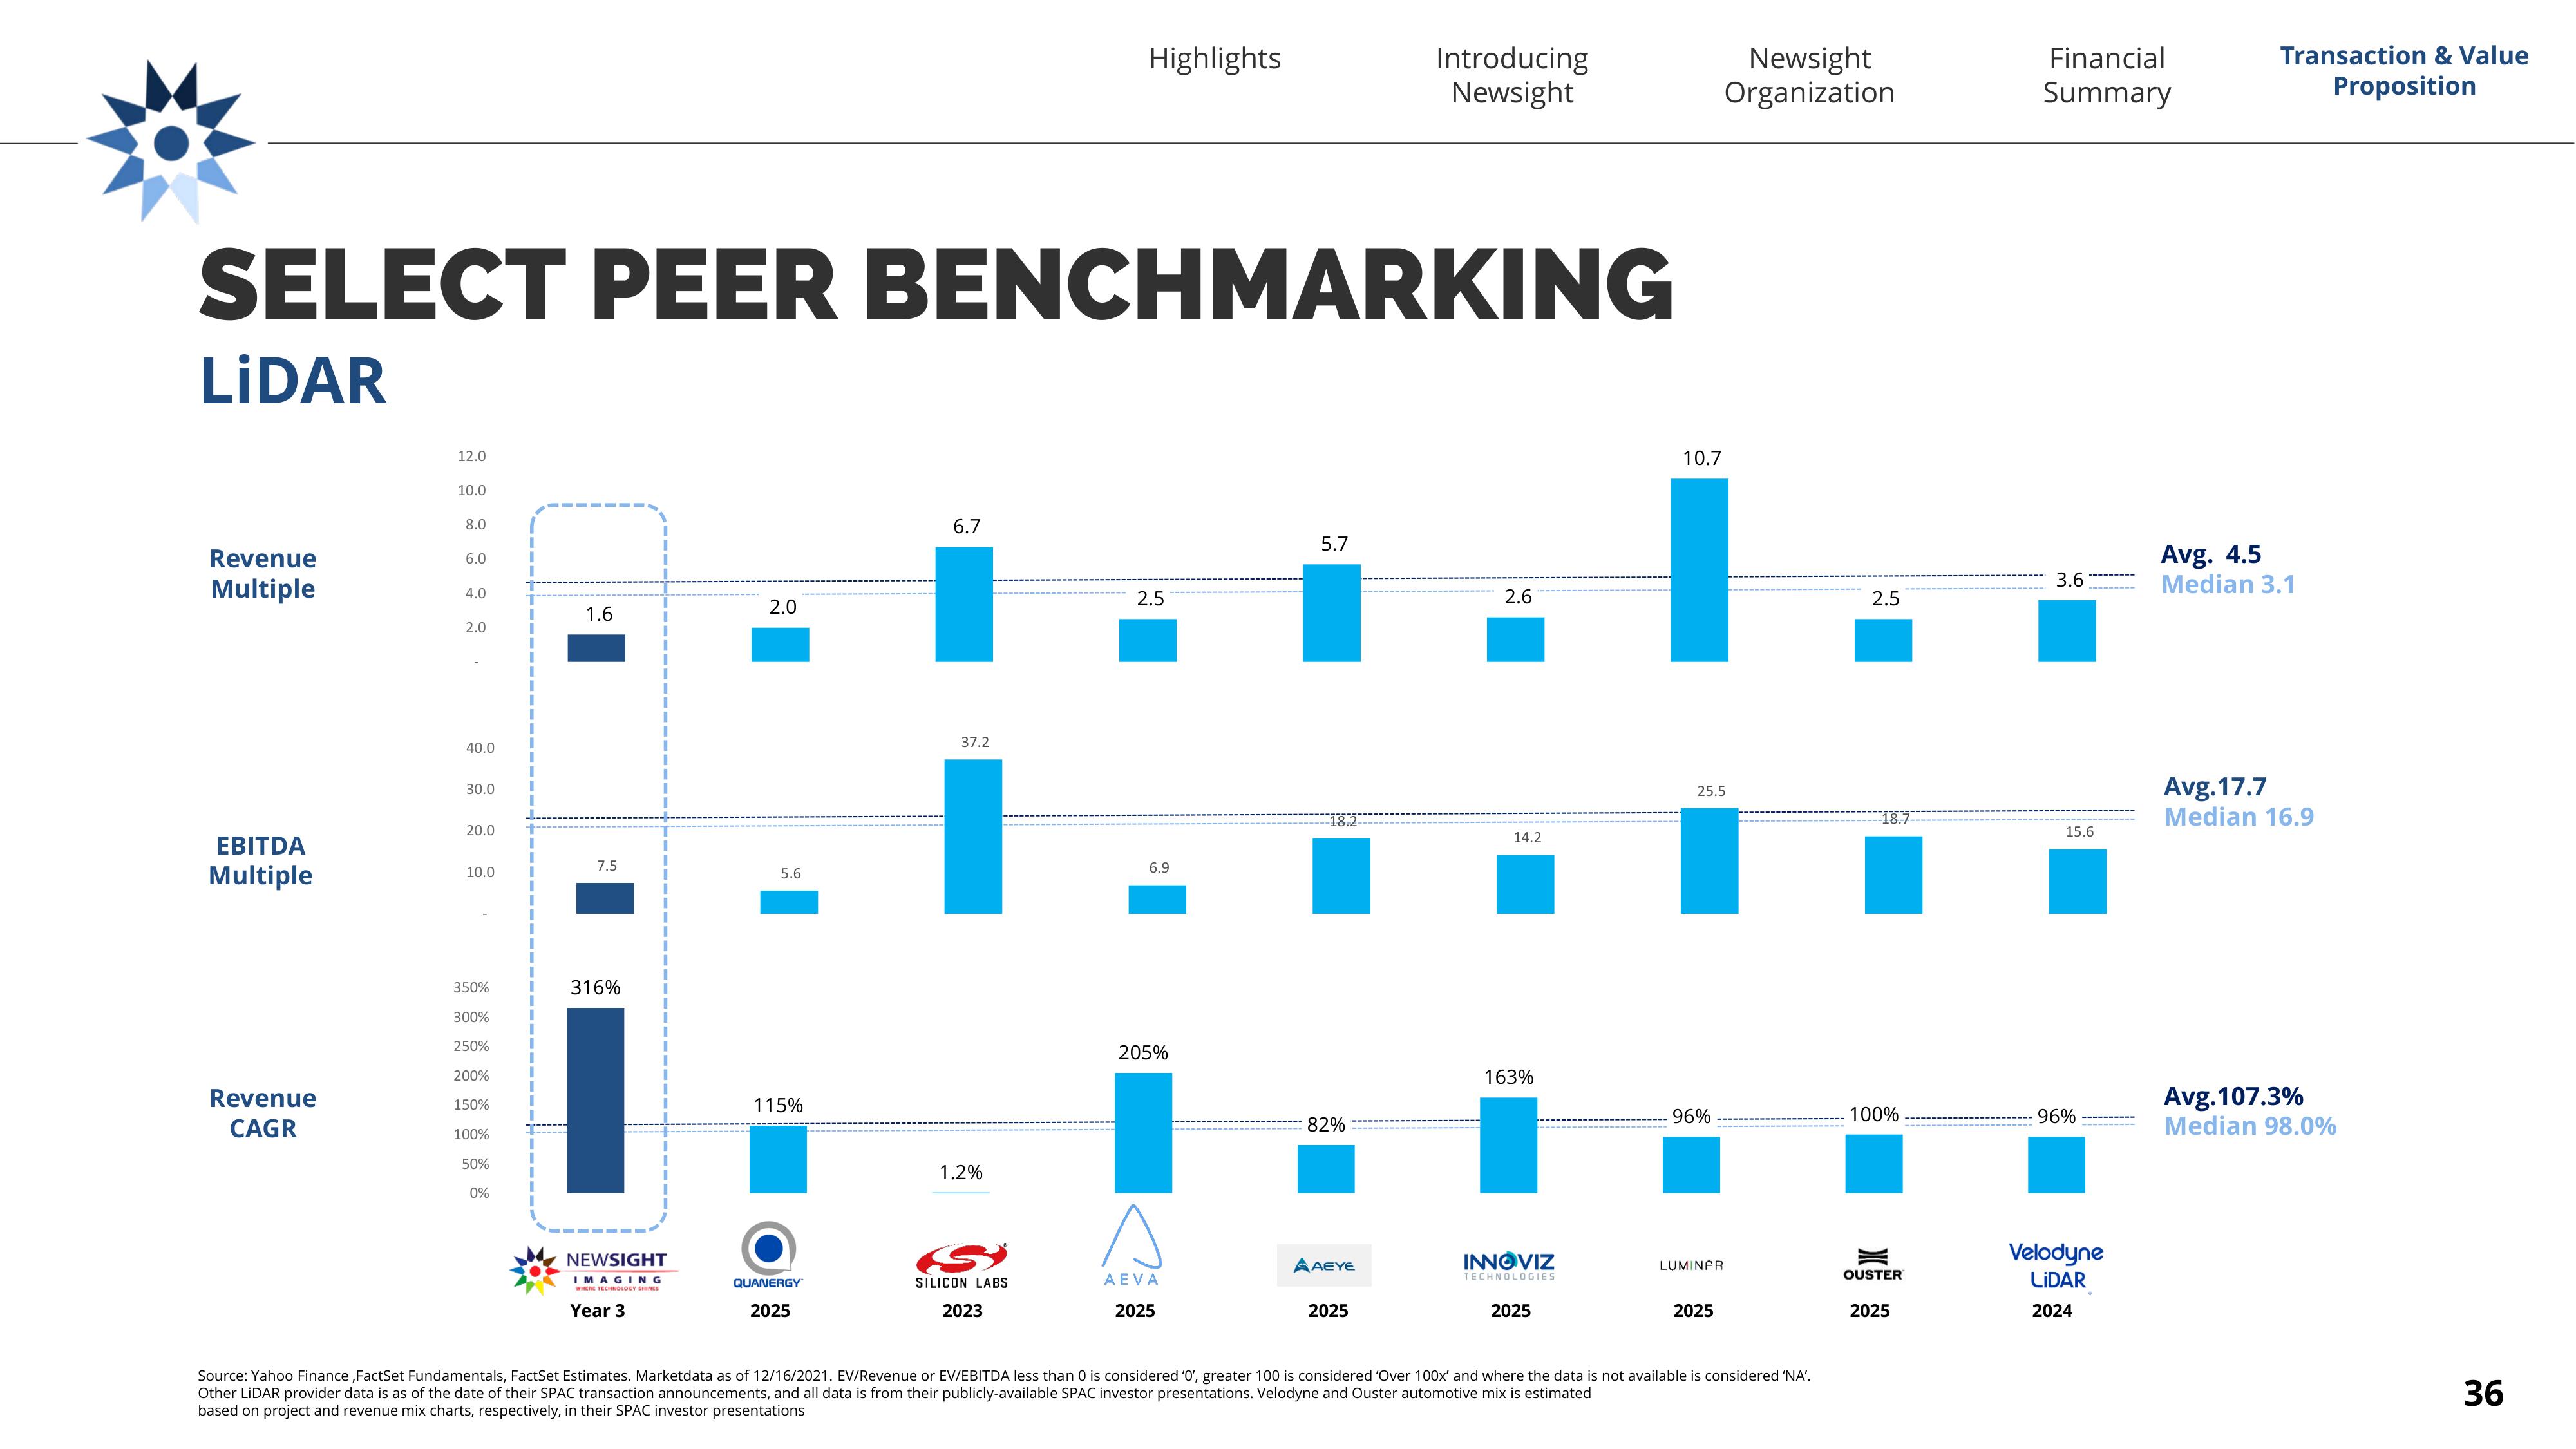
SELECT PEER BENCHMARKING
LIDAR
EBITDA
Multiple
Revenue
CAGR
12.0
10.0
8.0
6.0
4.0
2.0
40.0
30.0
20.0
10.0
350%
300%
250%
200%
150%
100%
50%
0%
1
1.6
7.5
316%
NEWSIGHT
IMAGING
Year 3
2.0
5.6
115%
QUANERGY
2025
6.7
37.2
1.2%
Highlights
SILICON LABS
2023
2.5
6.9
205%
AEVA
2025
5.7
18.2
82%
AAEYE
Introducing
Newsight
2025
2.6
14.2
163%
INNOVIZ
TECHNOLOGIES
2025
10.7
25.5
96%
LUMINAR
Newsight
Organization
2025
Source: Yahoo Finance,FactSet Fundamentals, FactSet Estimates. Marketdata as of 12/16/2021. EV/Revenue or EV/EBITDA less than 0 is considered '0', greater 100 is considered 'Over 100x' and where the data is not available is considered 'NA'.
Other LiDAR provider data is as of the date of their SPAC transaction announcements, and all data from their publicly-available SPAC investor presentations. Velodyne and Ouster automotive mix estimated
based on project and revenue mix charts, respectively, in their SPAC investor presentations
2.5
100%
OUSTER
2025
Financial
Summary
3.6¯¯¯¯¯¯¯¯¯
15.6
-96%
Velodyne
LIDAR
2024
Transaction & Value
Proposition
Avg. 4.5
Median 3.1
Avg.17.7
Median 16.9
Avg.107.3%
Median 98.0%
36View entire presentation