Vivid Seats Results Presentation Deck
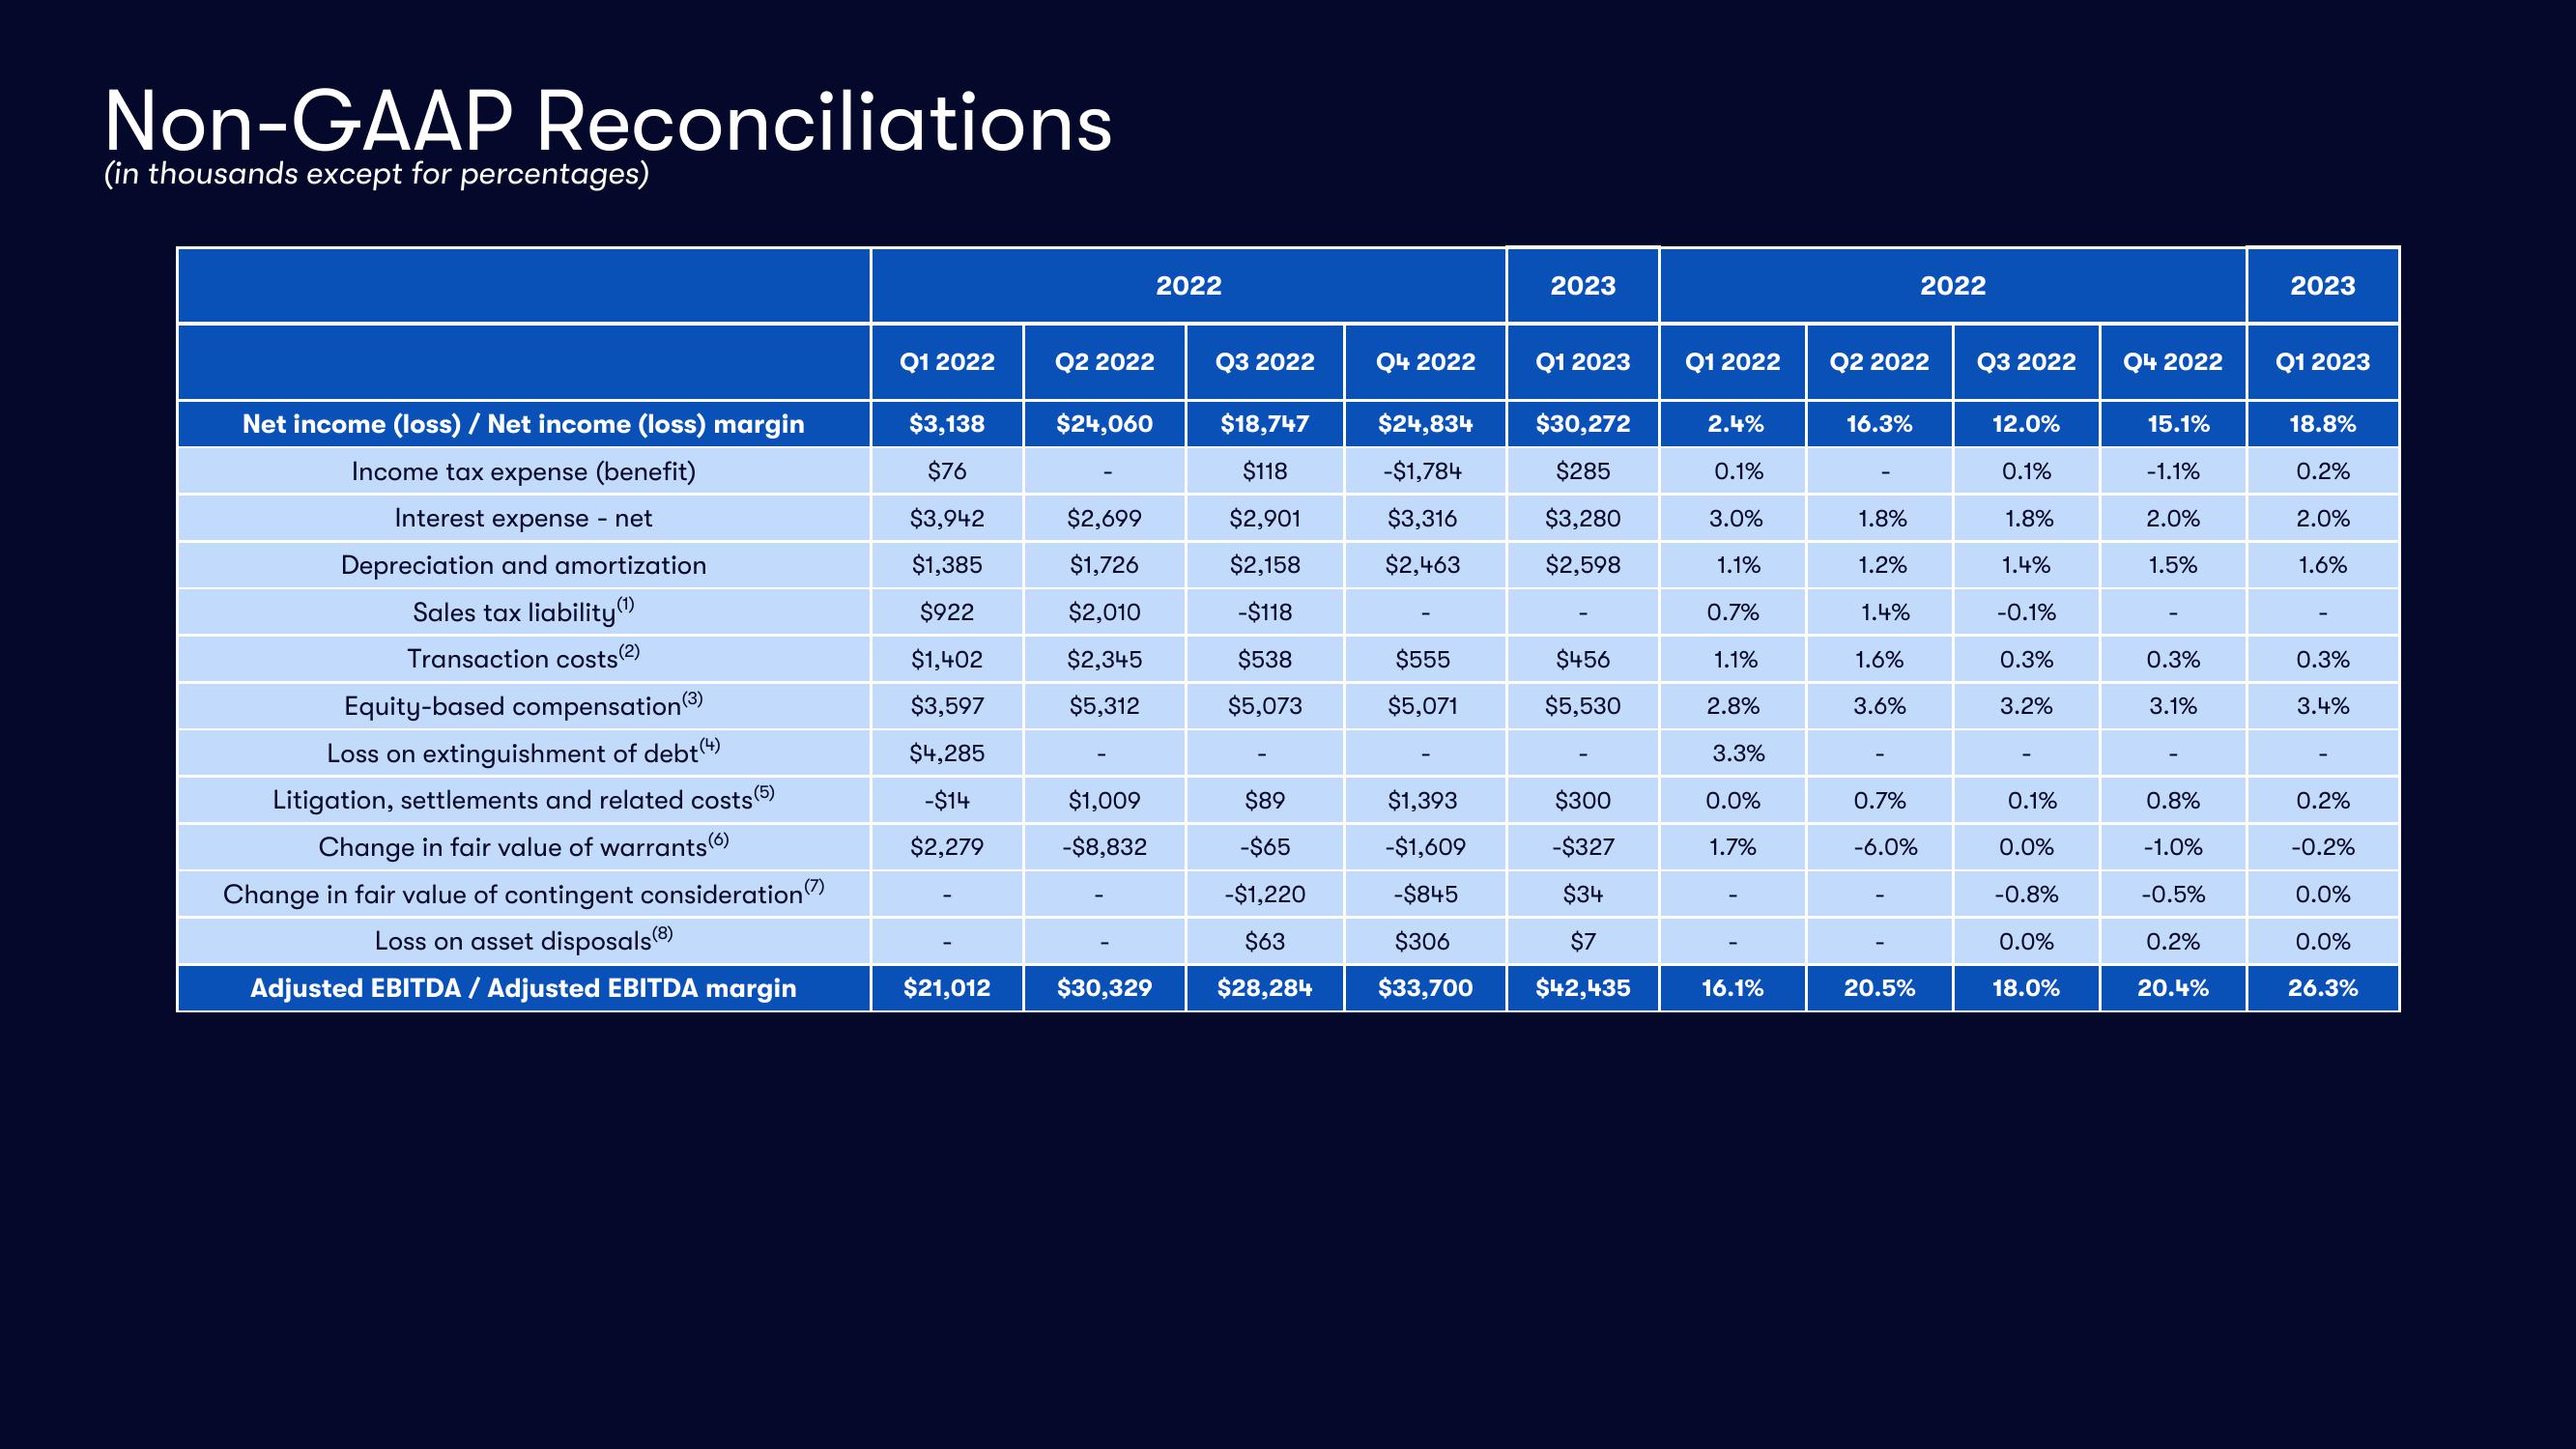
Non-GAAP Reconciliations
(in thousands except for percentages)
Net income (loss) / Net income (loss) margin
Income tax expense (benefit)
Interest expense - net
Depreciation and amortization
Sales tax liability
Transaction costs (2)
Equity-based compensation (3)
Loss on extinguishment of debt (4)
Litigation, settlements and related costs (5)
Change in fair value of warrants (6)
Change in fair value of contingent consideration
Loss on asset disposals(8)
Adjusted EBITDA / Adjusted EBITDA margin
Q1 2022
$3,138
$76
$3,942
$1,385
$922
$1,402
$3,597
$4,285
-$14
$2,279
$21,012
Q2 2022
$24,060
$2,699
$1,726
$2,010
$2,345
$5,312
$1,009
-$8,832
$30,329
2022
Q3 2022
$18,747
$118
$2,901
$2,158
-$118
$538
$5,073
$89
-$65
-$1,220
$63
$28,284
Q4 2022
$24,834
-$1,784
$3,316
$2,463
$555
$5,071
$1,393
-$1,609
-$845
$306
$33,700
2023
Q1 2023
$30,272
$285
$3,280
$2,598
$456
$5,530
$300
-$327
$34
$7
$42,435
Q1 2022
2.4%
0.1%
3.0%
1.1%
0.7%
1.1%
2.8%
3.3%
0.0%
1.7%
16.1%
Q2 2022
16.3%
1.8%
1.2%
1.4%
1.6%
3.6%
0.7%
-6.0%
2022
20.5%
Q3 2022
12.0%
0.1%
1.8%
1.4%
-0.1%
0.3%
3.2%
0.1%
0.0%
-0.8%
0.0%
18.0%
Q4 2022
15.1%
-1.1%
2.0%
1.5%
0.3%
3.1%
0.8%
-1.0%
-0.5%
0.2%
20.4%
2023
Q1 2023
18.8%
0.2%
2.0%
1.6%
0.3%
3.4%
0.2%
-0.2%
0.0%
0.0%
26.3%View entire presentation