Palantir Results Presentation Deck
Q2 Business Update
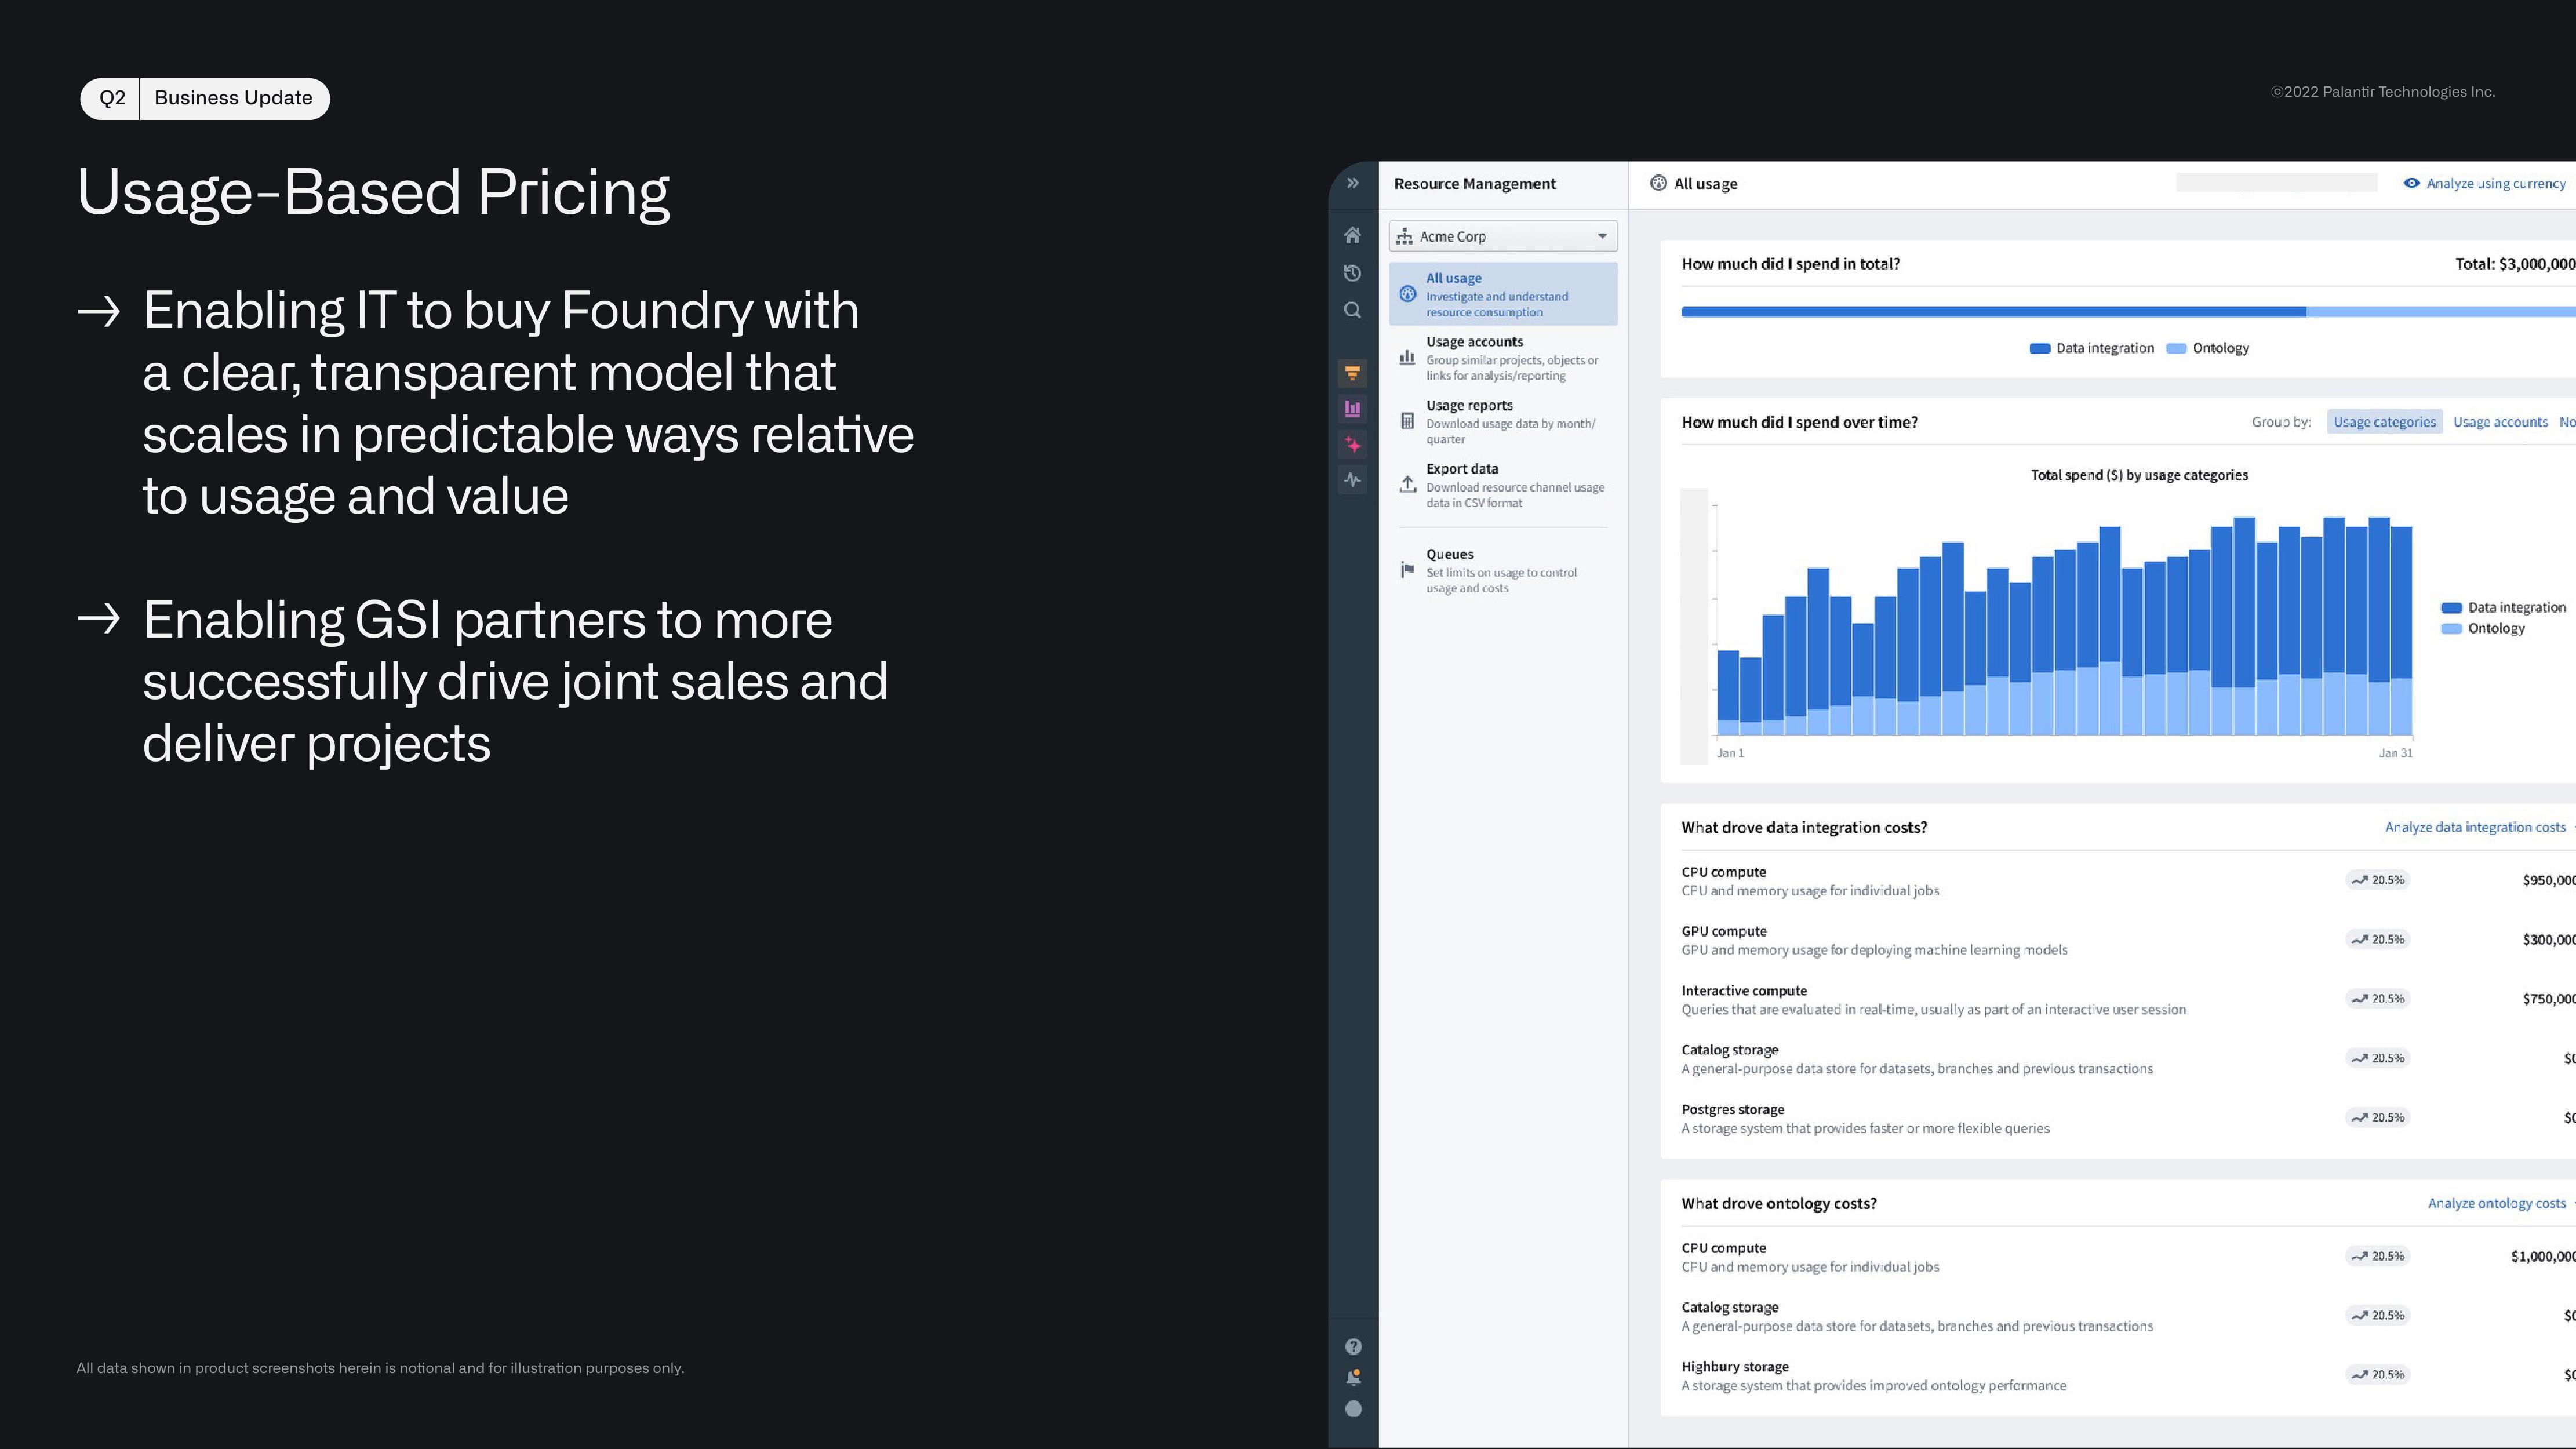
Usage-Based Pricing
Enabling IT to buy Foundry with
a clear, transparent model that
scales in predictable ways relative
to usage and value
→ Enabling GSI partners to more
successfully drive joint sales and
deliver projects
All data shown in product screenshots herein is notional and for illustration purposes only.
< 90
+3
Resource Management
Acme Corp
All usage
Investigate and understand
resource consumption
Usage accounts
Group similar projects, objects or
links for analysis/reporting
Usage reports
Download usage data by month/
quarter
Export data
1, Download resource channel usage
data in CSV format
Queues
Set limits on usage to control
usage and costs
All usage
How much did I spend in total?
How much did I spend over time?
Jan 1
What drove data integration costs?
CPU compute
CPU and memory usage for individual jobs
GPU compute
GPU and memory usage for deploying machine leaming models
Data integration Ontology
Total spend ($) by usage categories
Interactive compute
Queries that are evaluated in real-time, usually as part of an interactive user session
Catalog storage
A general-purpose data store for datasets, branches and previous transactions
Postgres storage
A storage system that provides faster or more flexible queries
What drove ontology costs?
CPU compute
CPU and memory usage for individual jobs
Catalog storage
A general-purpose data store for datasets, branches and previous transactions
Highbury storage
A storage system that provides improved ontology performance
Ⓒ2022 Palantir Technologies Inc.
Group by:
Jan 31
Usage categories Usage accounts No
20.5%
20.5%
Analyze data integration costs
20.596 الى
20.5%
20.5%
20.5%
Analyze using currency
20.5%
Total: $3,000,000
20.5%
Data integration
Ontology
$950,000
$300,000
$750,000
$C
SC
Analyze ontology costs
$1,000,000
$C
soView entire presentation