Hydrafacial Results Presentation Deck
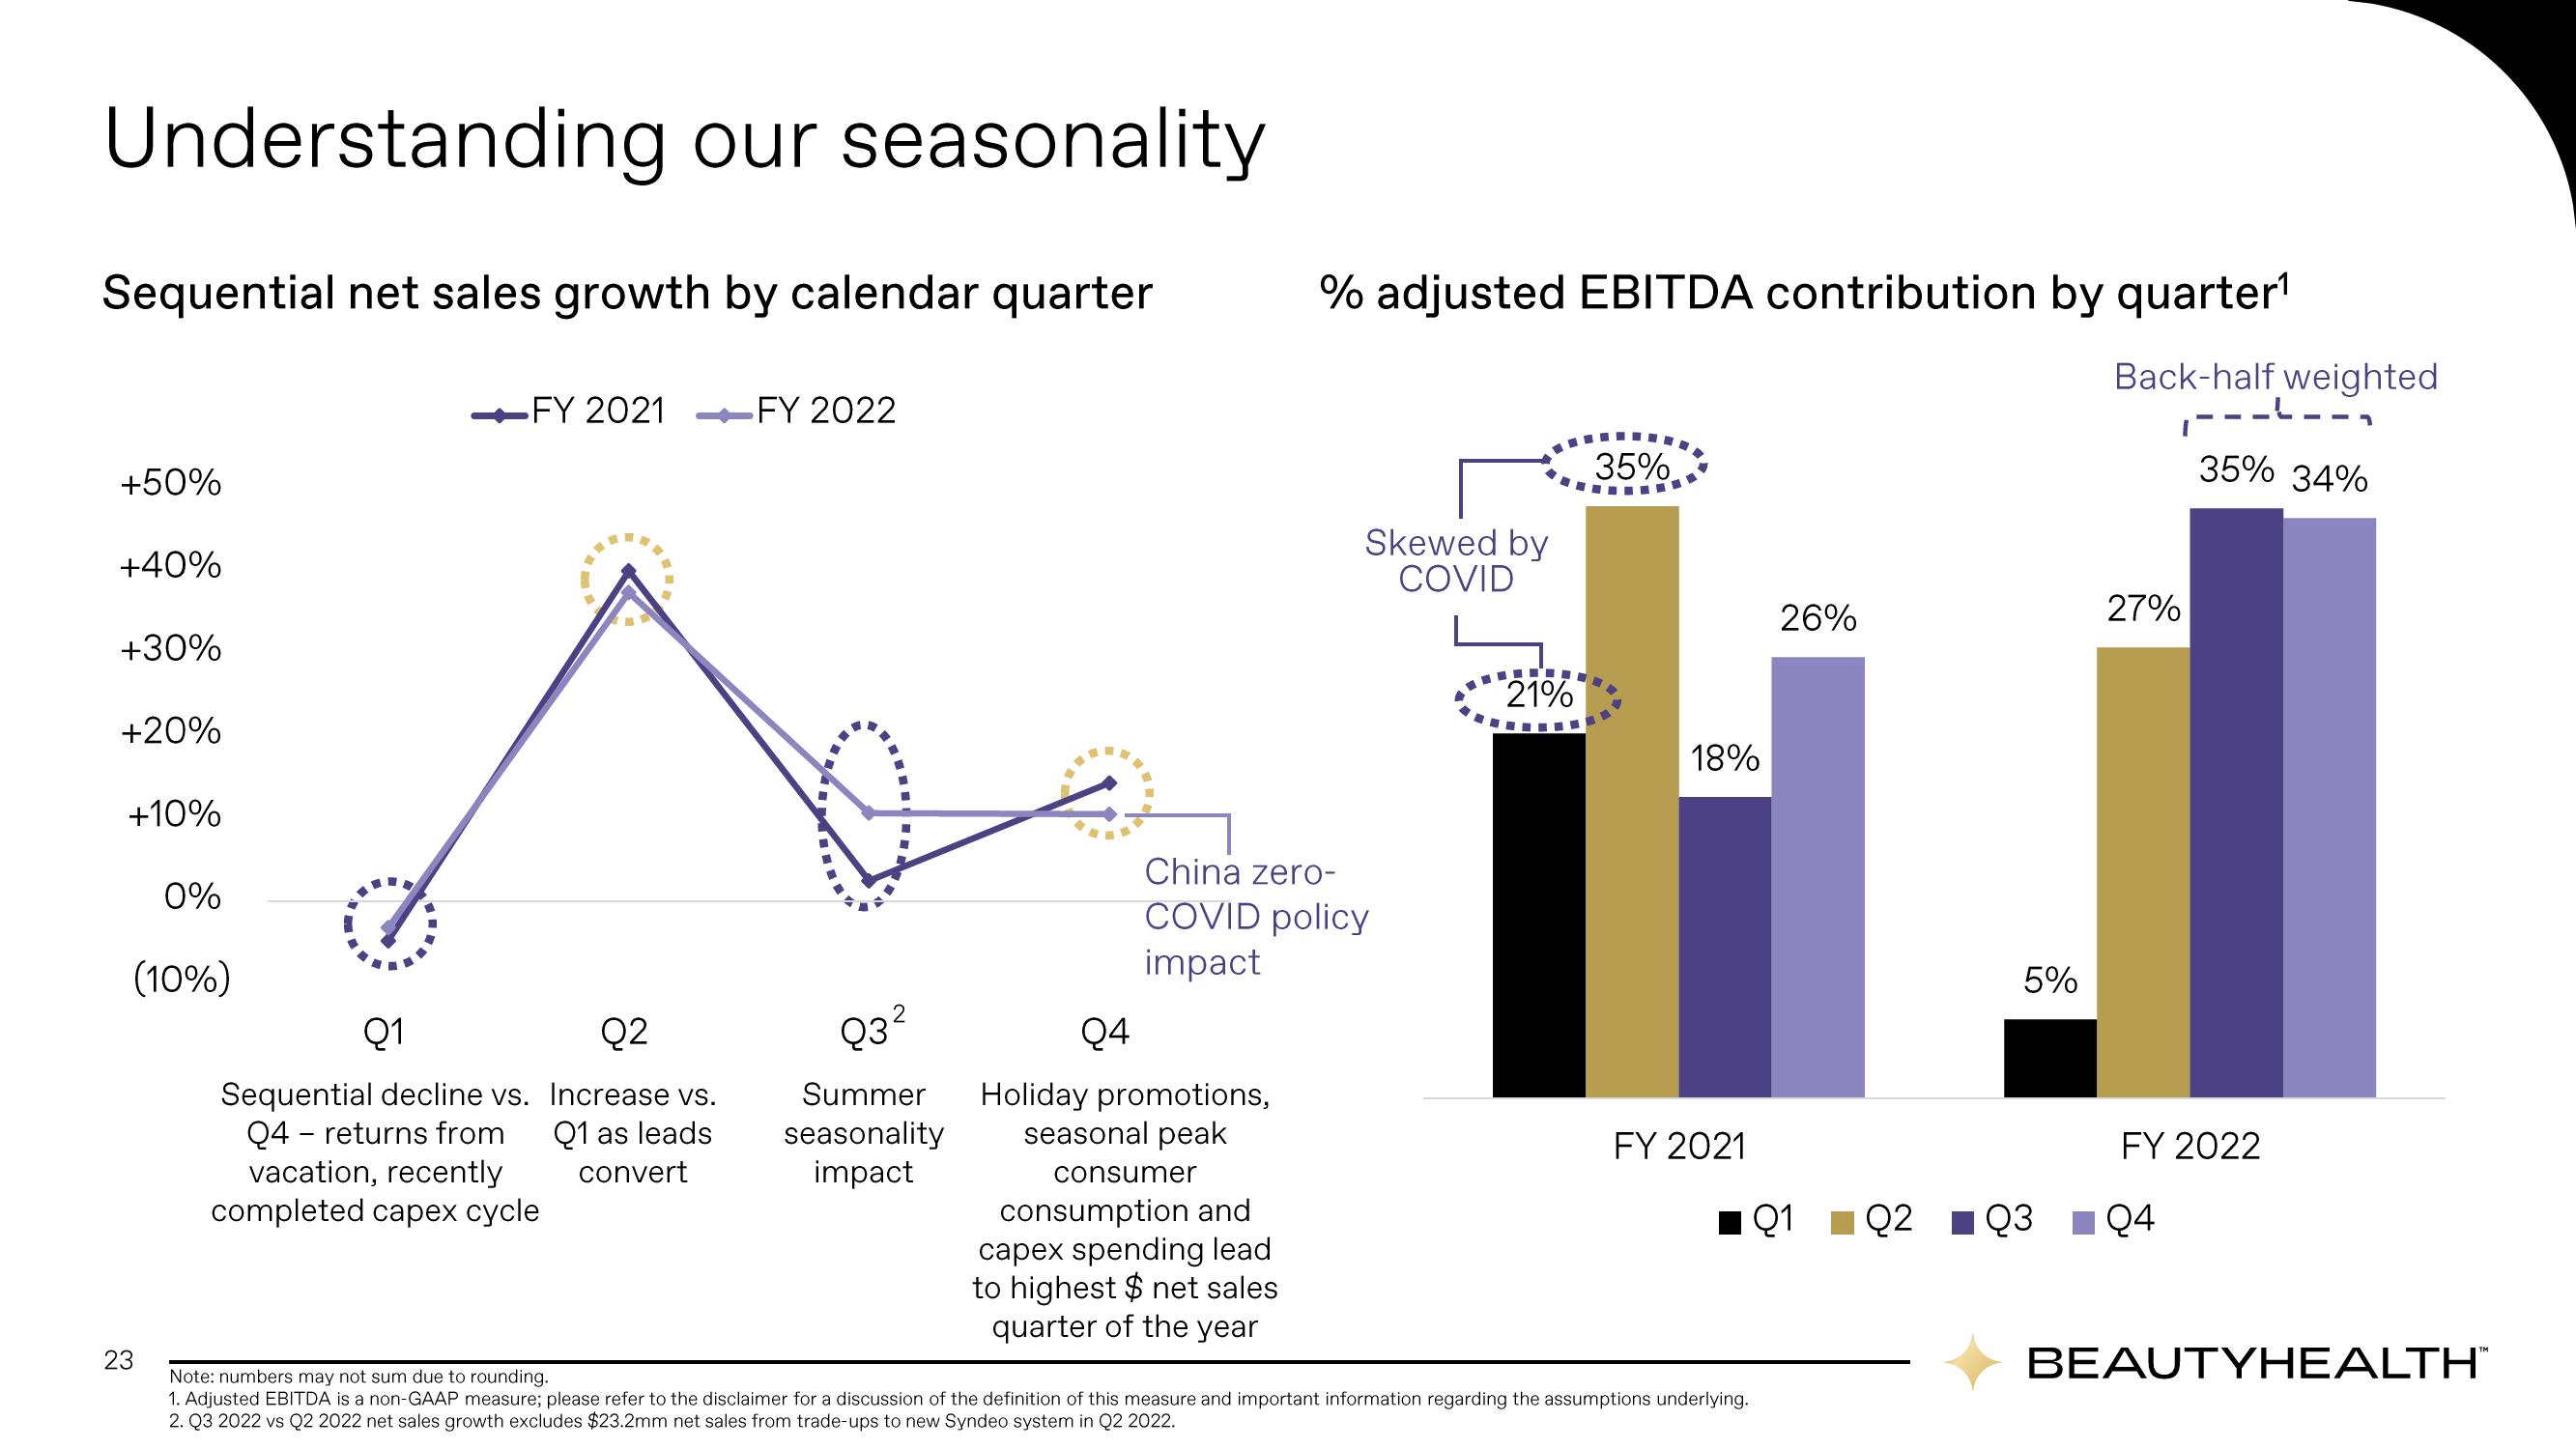
Understanding our seasonality
Sequential net sales growth by calendar quarter
+50%
+40%
+30%
+20%
+10%
23
0%
(10%)
-FY 2021
Q1
Q2
Sequential decline vs. Increase vs.
Q4 - returns from
Q1 as leads
vacation, recently convert
completed capex cycle
FY 2022
03
Summer
seasonality
impact
Q4
Holiday promotions,
seasonal peak
% adjusted EBITDA contribution by quarter¹
Back-half weighted
China zero-
COVID policy
impact
consumer
consumption and
capex spending lead
to highest $ net sales
quarter of the year
Skewed by
COVID
21%
35%
18%
FY 2021
Note: numbers may not sum due to rounding.
1. Adjusted EBITDA is a non-GAAP measure; please refer to the disclaimer for a discussion of the definition of this measure and important information regarding the assumptions underlying.
2. Q3 2022 vs Q2 2022 net sales growth excludes $23.2mm net sales from trade-ups to new Syndeo system in Q2 2022.
26%
5%
27%
35% 34%
FY 2022
Q2 Q3 Q4
BEAUTYHEALTH™View entire presentation