OppFi Results Presentation Deck
24
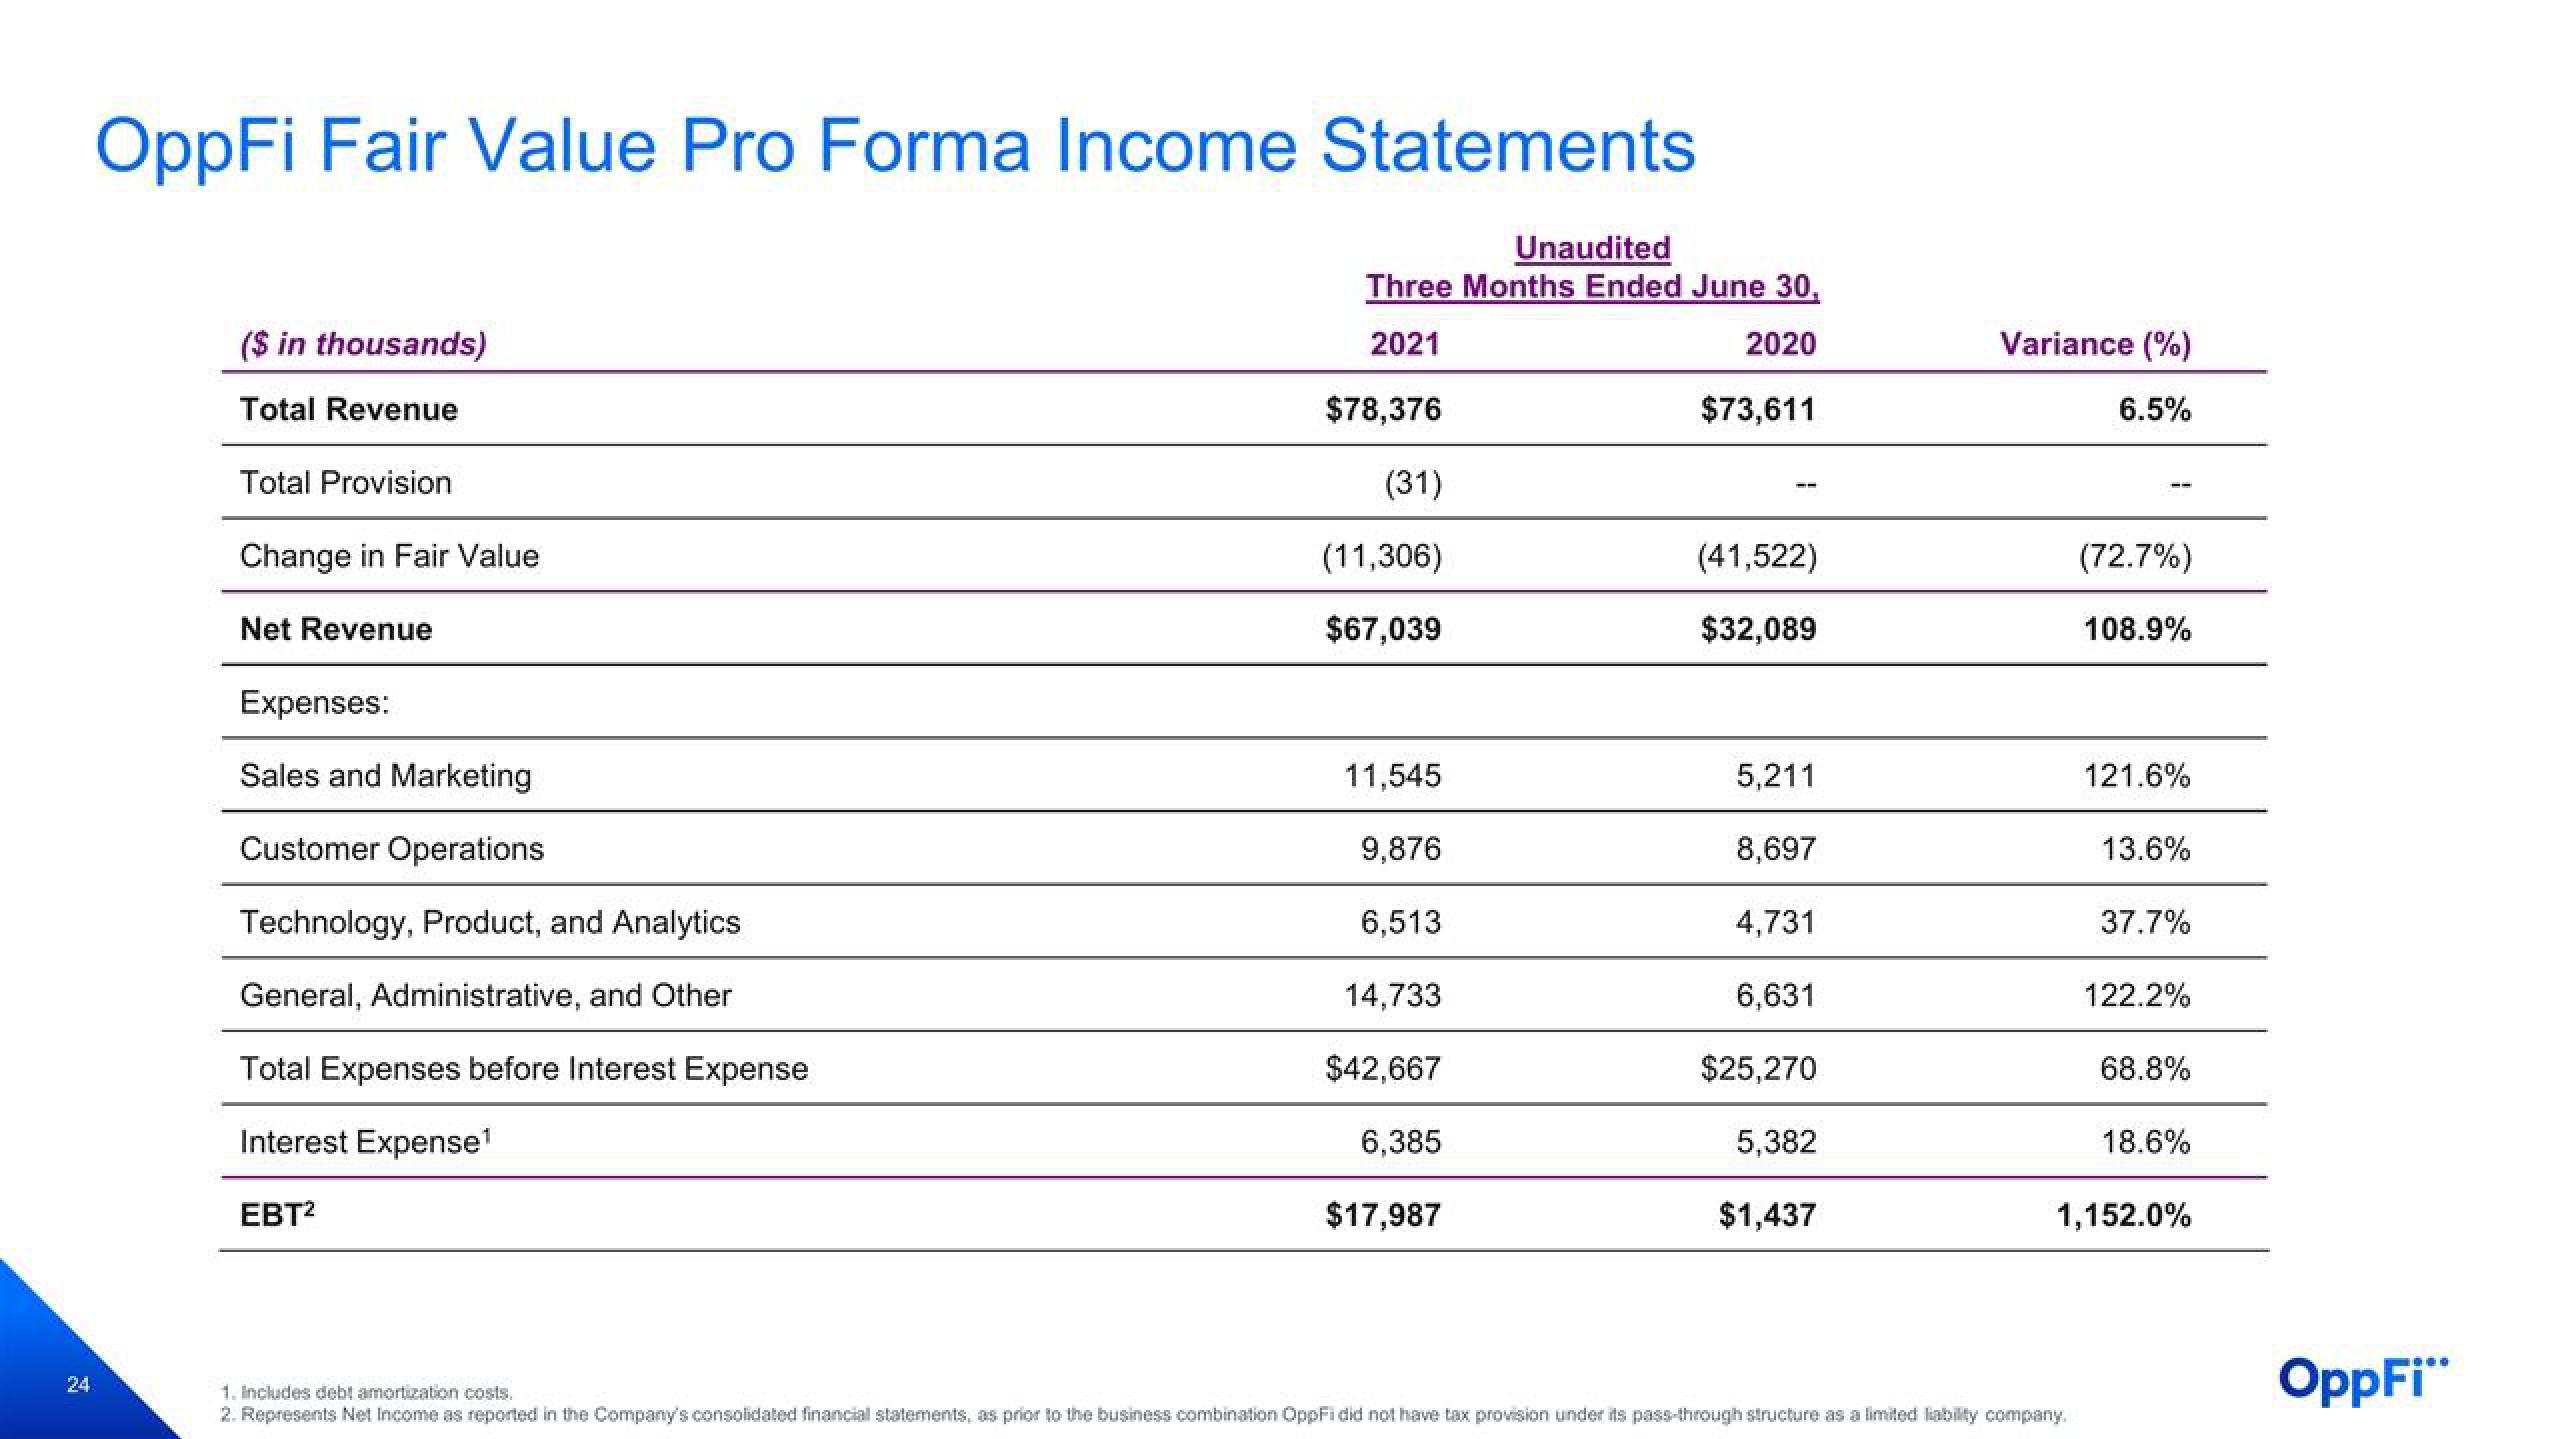
OppFi Fair Value Pro Forma Income Statements
($ in thousands)
Total Revenue
Total Provision
Change in Fair Value
Net Revenue
Expenses:
Sales and Marketing
Customer Operations
Technology, Product, and Analytics
General, Administrative, and Other
Total Expenses before Interest Expense
Interest Expense¹
EBT²
Unaudited
Three Months Ended June 30,
2021
2020
$78,376
$73,611
(31)
(11,306)
$67,039
11,545
9,876
6,513
14,733
$42,667
6,385
$17,987
(41,522)
$32,089
5,211
8,697
4,731
6,631
$25,270
5,382
$1,437
Variance (%)
6.5%
(72.7%)
108.9%
1. Includes debt amortization costs.
2. Represents Net Income as reported in the Company's consolidated financial statements, as prior to the business combination OppFi did not have tax provision under its pass-through structure as a limited liability company.
121.6%
13.6%
37.7%
122.2%
68.8%
18.6%
1,152.0%
OppFi"View entire presentation