Synchrony Financial Results Presentation Deck
2021 Framework on Key Drivers
(comments and trends in comparison to 2020, except where noted)
Purchase Volume
Loan Receivable Growth
Net Interest Margin
Provision for Credit Losses
RSAS - % of ALR
Operating Expenses
synchrony
●
●
●
●
●
●
●
●
●
●
●
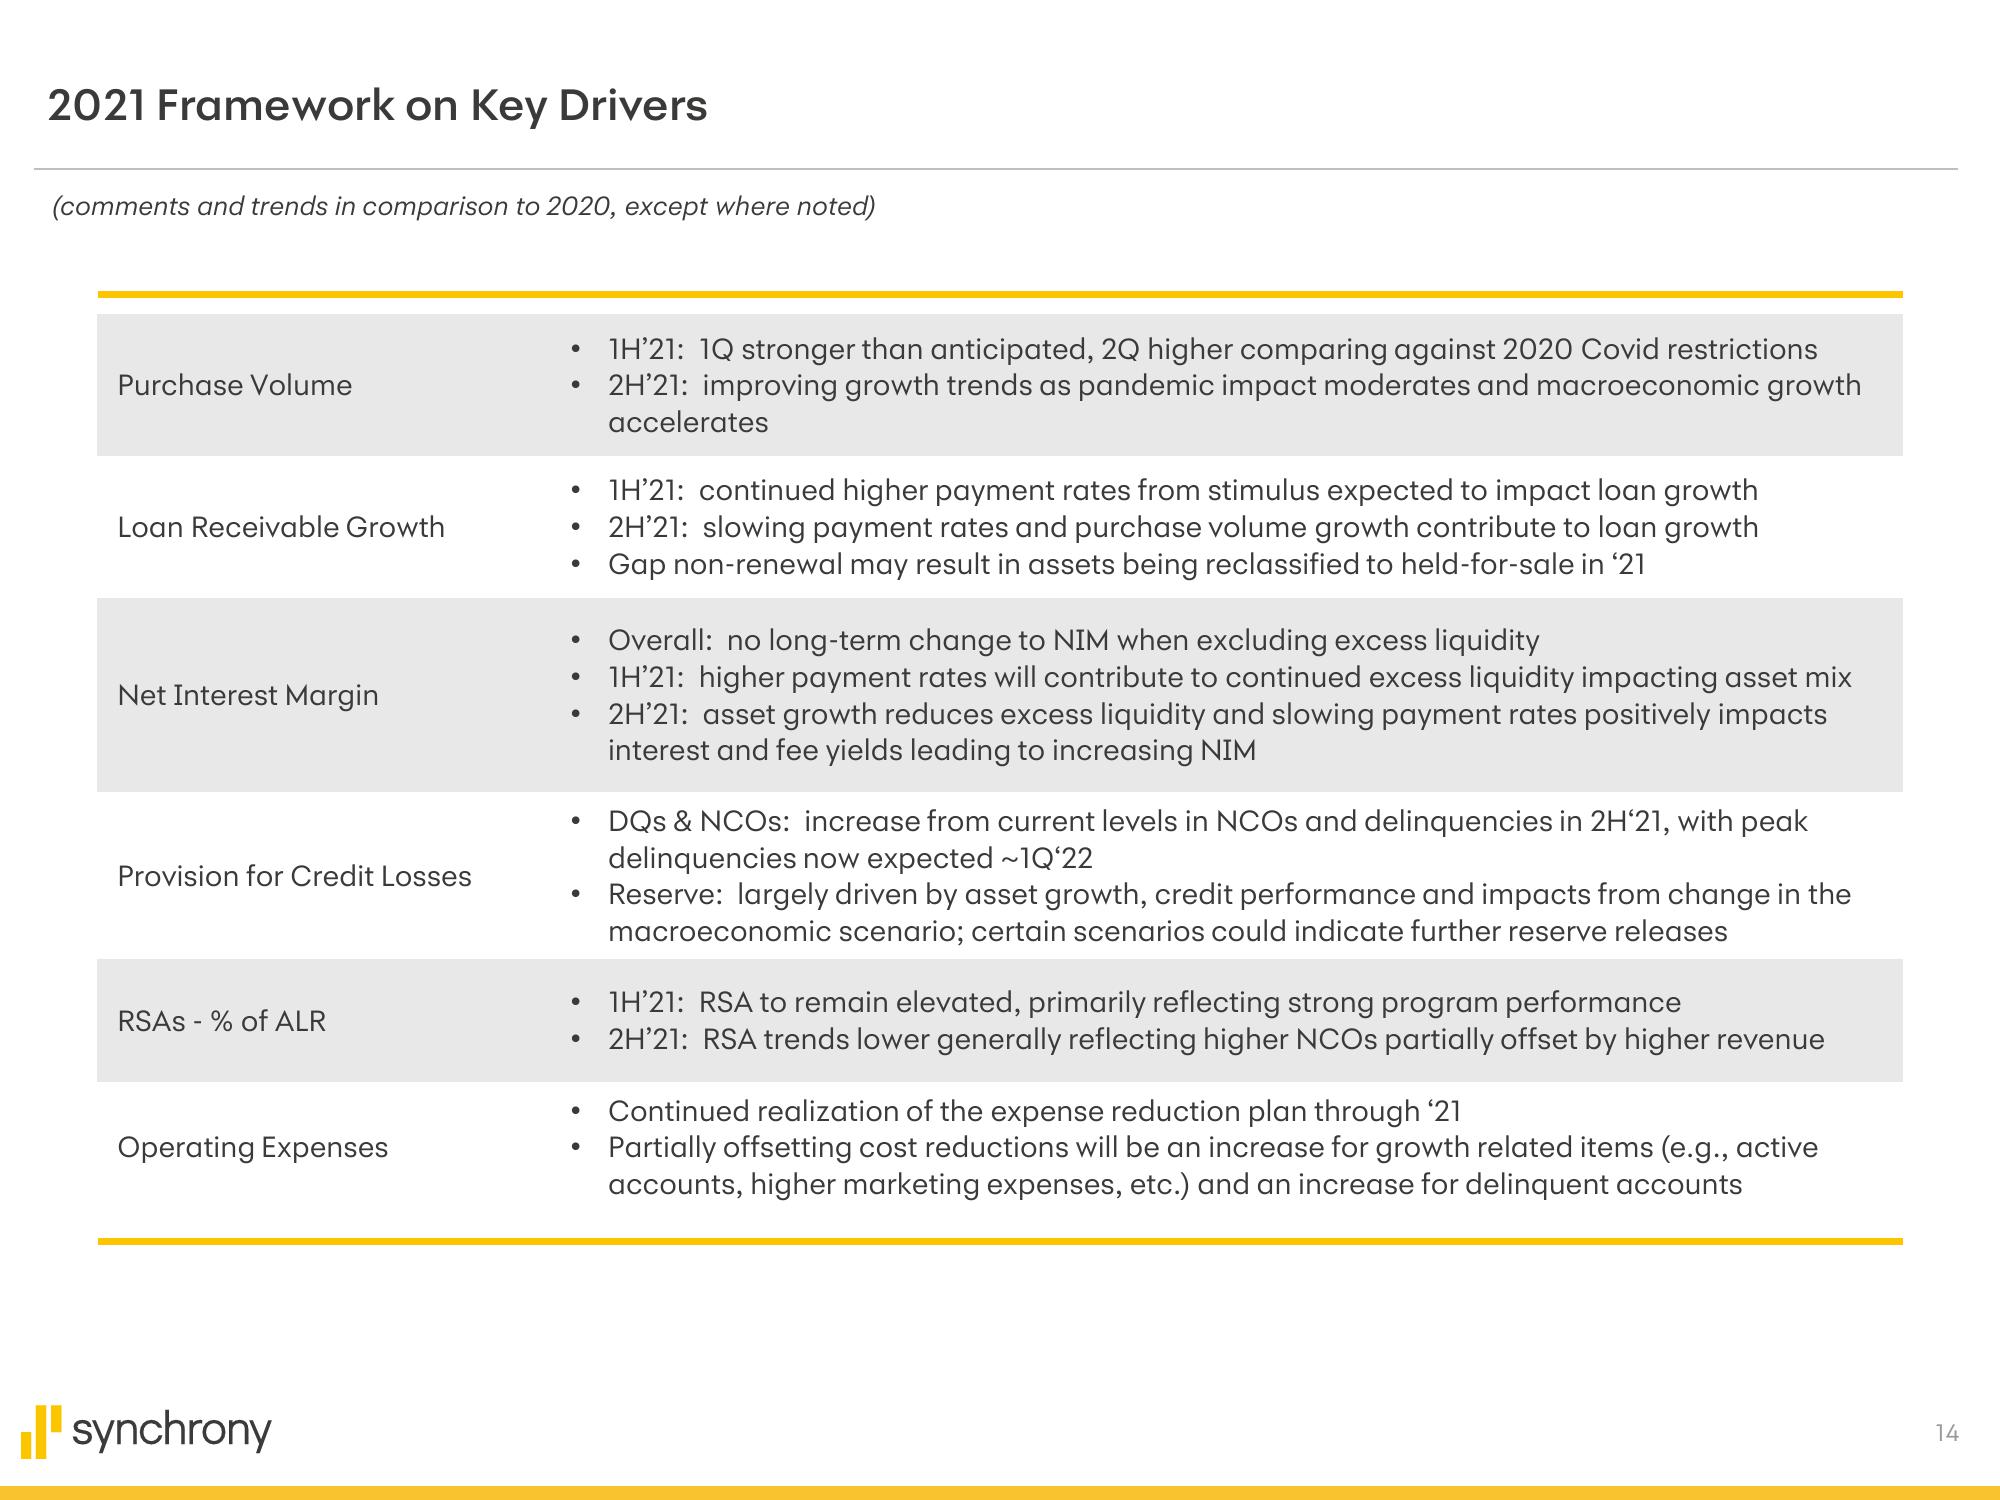
1H'21: 1Q stronger than anticipated, 2Q higher comparing against 2020 Covid restrictions
2H'21: improving growth trends as pandemic impact moderates and macroeconomic growth
accelerates
1H'21: continued higher payment rates from stimulus expected to impact loan growth
2H'21: slowing payment rates and purchase volume growth contribute to loan growth
Gap non-renewal may result in assets being reclassified to held-for-sale in '21
Overall: no long-term change to NIM when excluding excess liquidity
1H'21: higher payment rates will contribute to continued excess liquidity impacting asset mix
2H'21: asset growth reduces excess liquidity and slowing payment rates positively impacts
interest and fee yields leading to increasing NIM
DQs & NCOS: increase from current levels in NCOs and delinquencies in 2H'21, with peak
delinquencies now expected ~1Q'22
Reserve: largely driven by asset growth, credit performance and impacts from change in the
macroeconomic scenario; certain scenarios could indicate further reserve releases
1H'21: RSA to remain elevated, primarily reflecting strong program performance
2H'21: RSA trends lower generally reflecting higher NCOs partially offset by higher revenue
Continued realization of the expense reduction plan through '21
Partially offsetting cost reductions will be an increase for growth related items (e.g., active
accounts, higher marketing expenses, etc.) and an increase for delinquent accounts
14View entire presentation