Oatly Results Presentation Deck
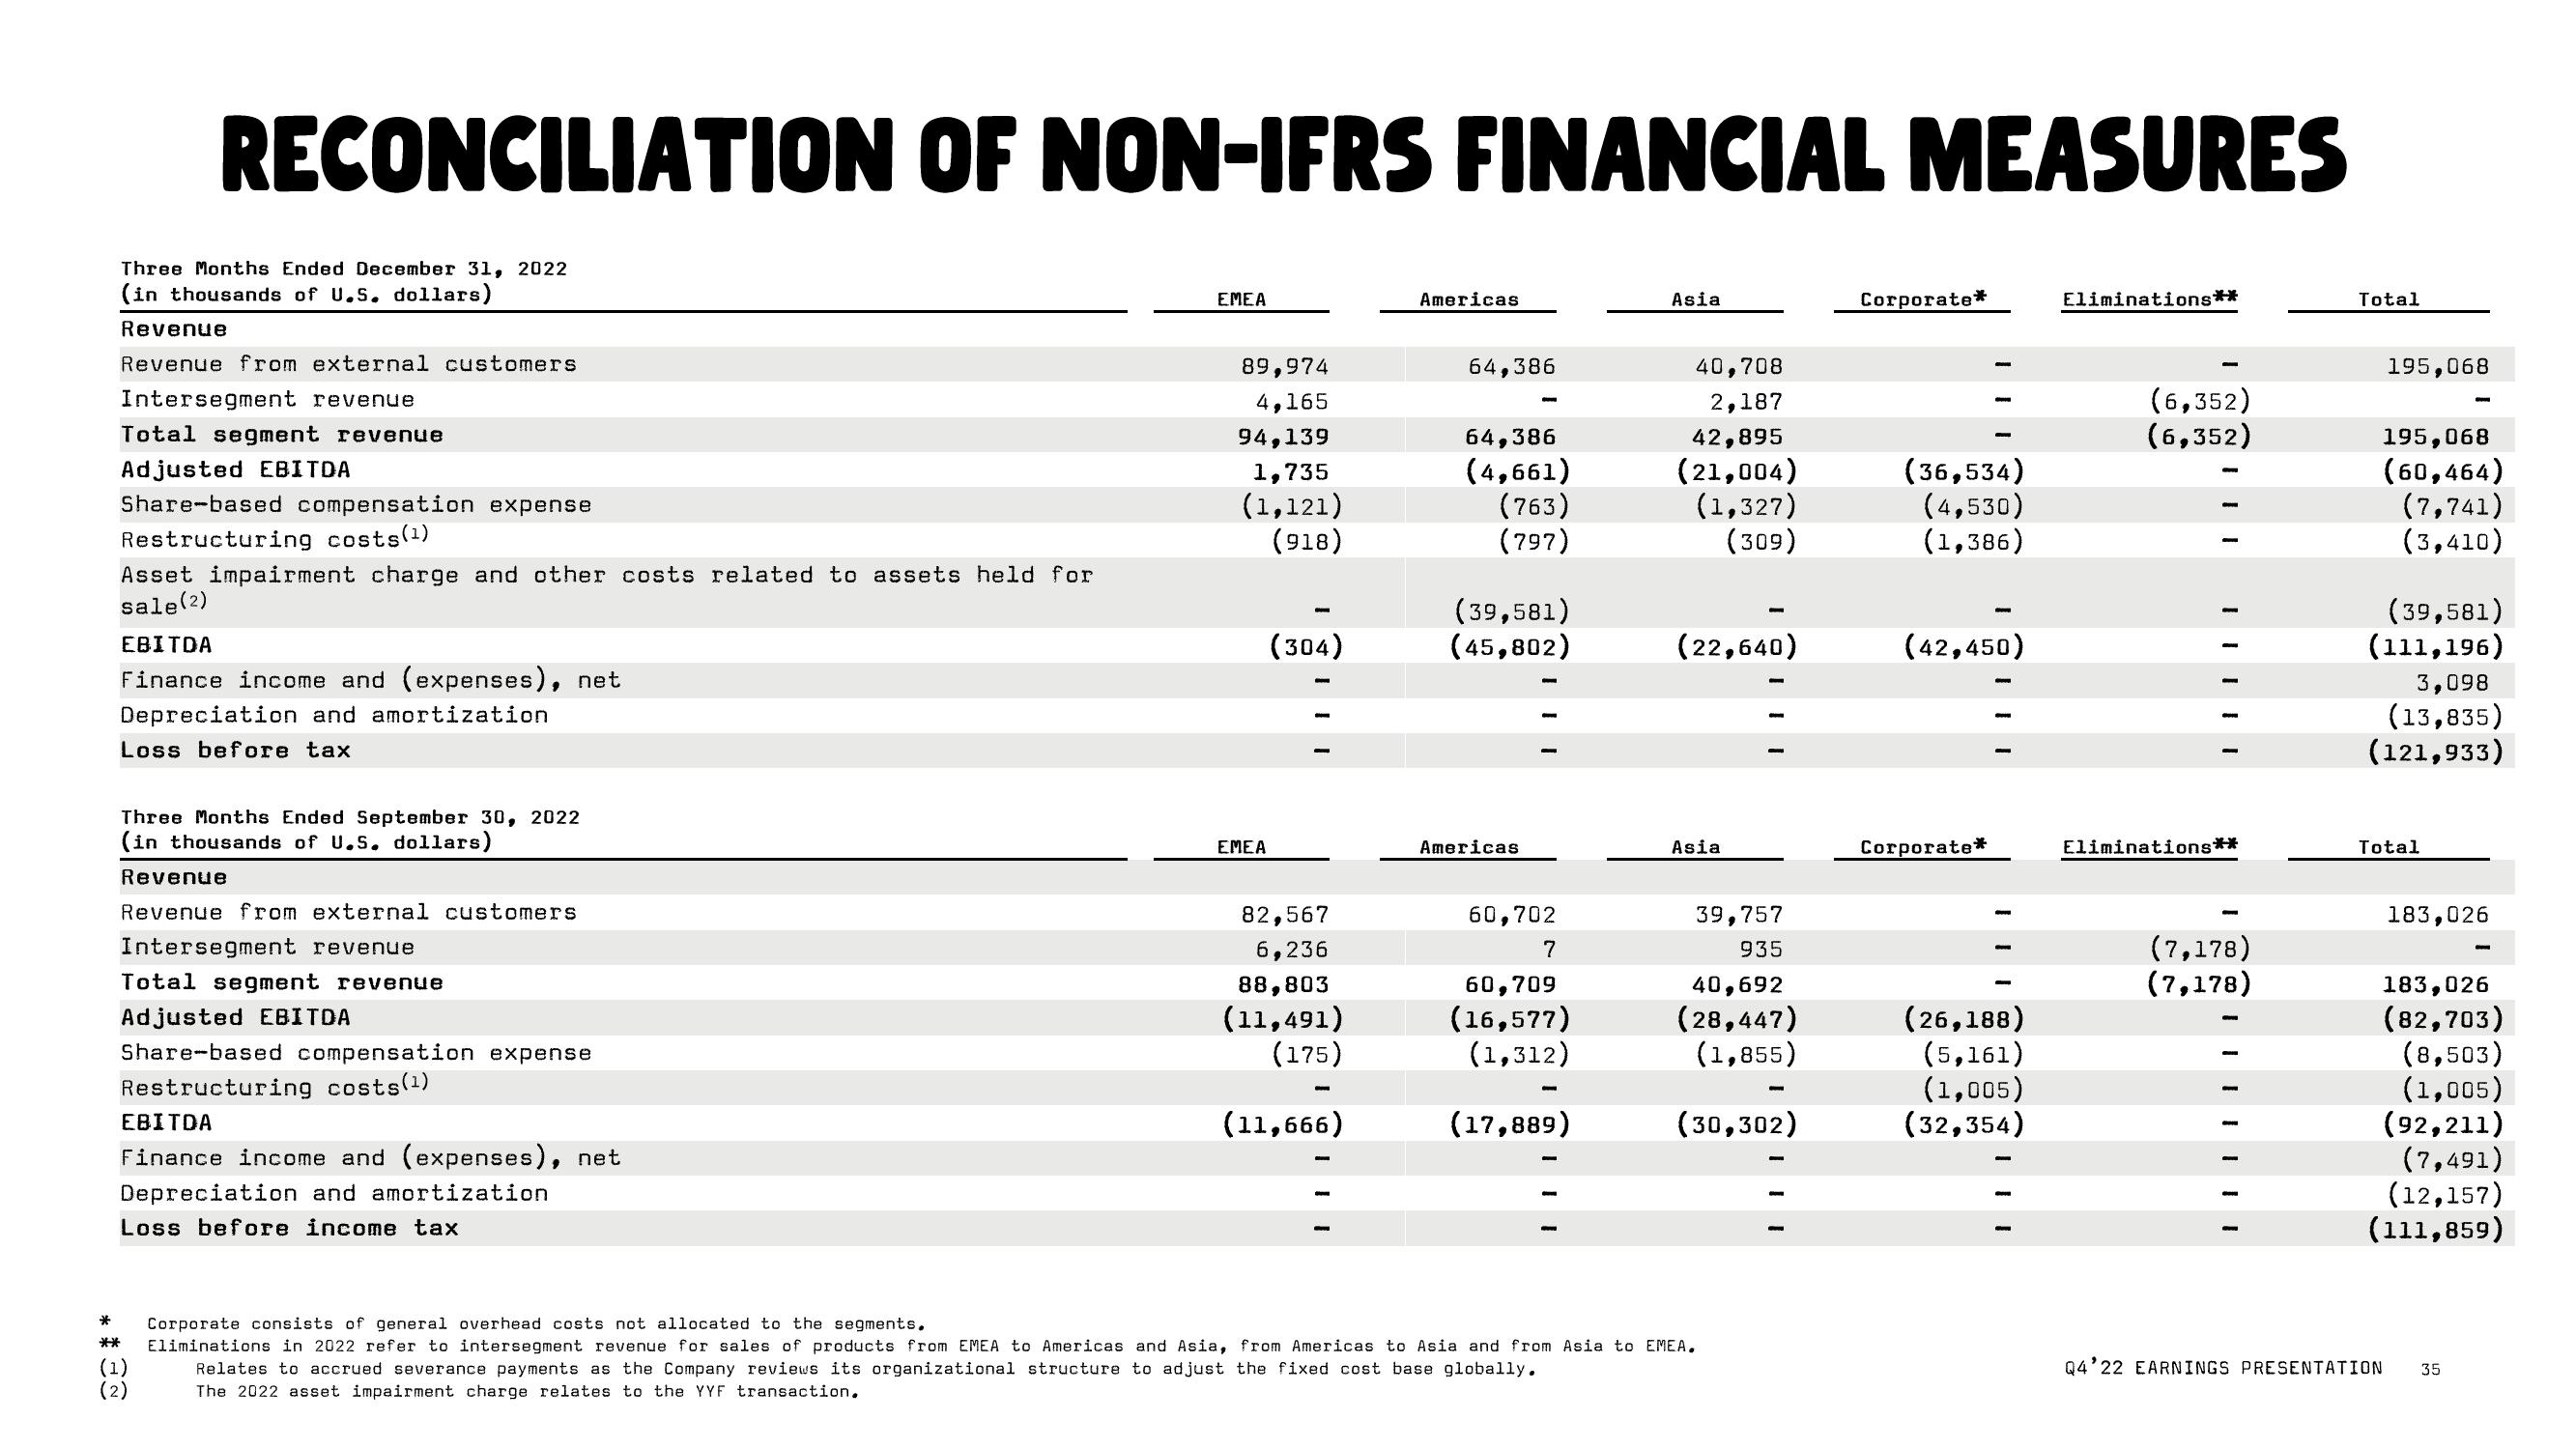
RECONCILIATION OF NON-IFRS FINANCIAL MEASURES
Three Months Ended December 31, 2022
(in thousands of U.S. dollars)
Revenue
Revenue from external customers
Intersegment revenue
Total segment revenue
Adjusted EBITDA
Share-based compensation expense
Restructuring costs(¹)
Asset impairment charge and other costs related to assets held for
sale (2)
EBITDA
Finance income and (expenses), net
Depreciation and amortization
Loss before tax
Three Months Ended September 30, 2022
(in thousands of U.S. dollars)
Revenue
Revenue from external customers
Intersegment revenue
Total segment revenue
Adjusted EBITDA
Share-based compensation expense
Restructuring costs(¹)
EBITDA
Finance income and (expenses), net
Depreciation and amortization
Loss before income tax
**
(1)
(2)
EMEA
89,974
4,165
94,139
1,735
(1,121)
(918)
EMEA
(304)
82,567
6,236
88,803
(11,491)
(175)
(11,666)
M
Americas
64,386
64,386
(4,661)
(763)
(797)
(39,581)
(45,802)
Americas
60,702
7
60,709
(16,577)
(1,312)
-
(17,889)
-
Asia
40,708
2,187
42,895
(21,004)
(1,327)
(309)
(22,640)
Asia
39,757
935
40,692
(28,447)
(1,855)
(30,302)
Corporate consists of general overhead costs not allocated to the segments.
Eliminations in 2022 refer to intersegment revenue for sales of products from EMEA to Americas and Asia, from Americas to Asia and from Asia to EMEA.
Relates to accrued severance payments as the Company reviews its organizational structure to adjust the fixed cost base globally.
The 2022 asset impairment charge relates to the YYF transaction.
Corporate*
(36,534)
(4,530)
(1,386)
(42,450)
Corporate*
(26,188)
(5,161)
(1,005)
(32,354)
Eliminations**
(6,352)
(6,352)
Eliminations**
(7,178)
(7,178)
IIII
Total
195,068
195,068
(60,464)
(7,741)
(3,410)
(39,581)
(111,196)
3,098
(13,835)
(121,933)
Total
183,026
183,026
(82,703)
(8,503)
(1,005)
(92,211)
(7,491)
(12,157)
(111,859)
Q4'22 EARNINGS PRESENTATION 35View entire presentation