Netstreit Investor Presentation Deck
1
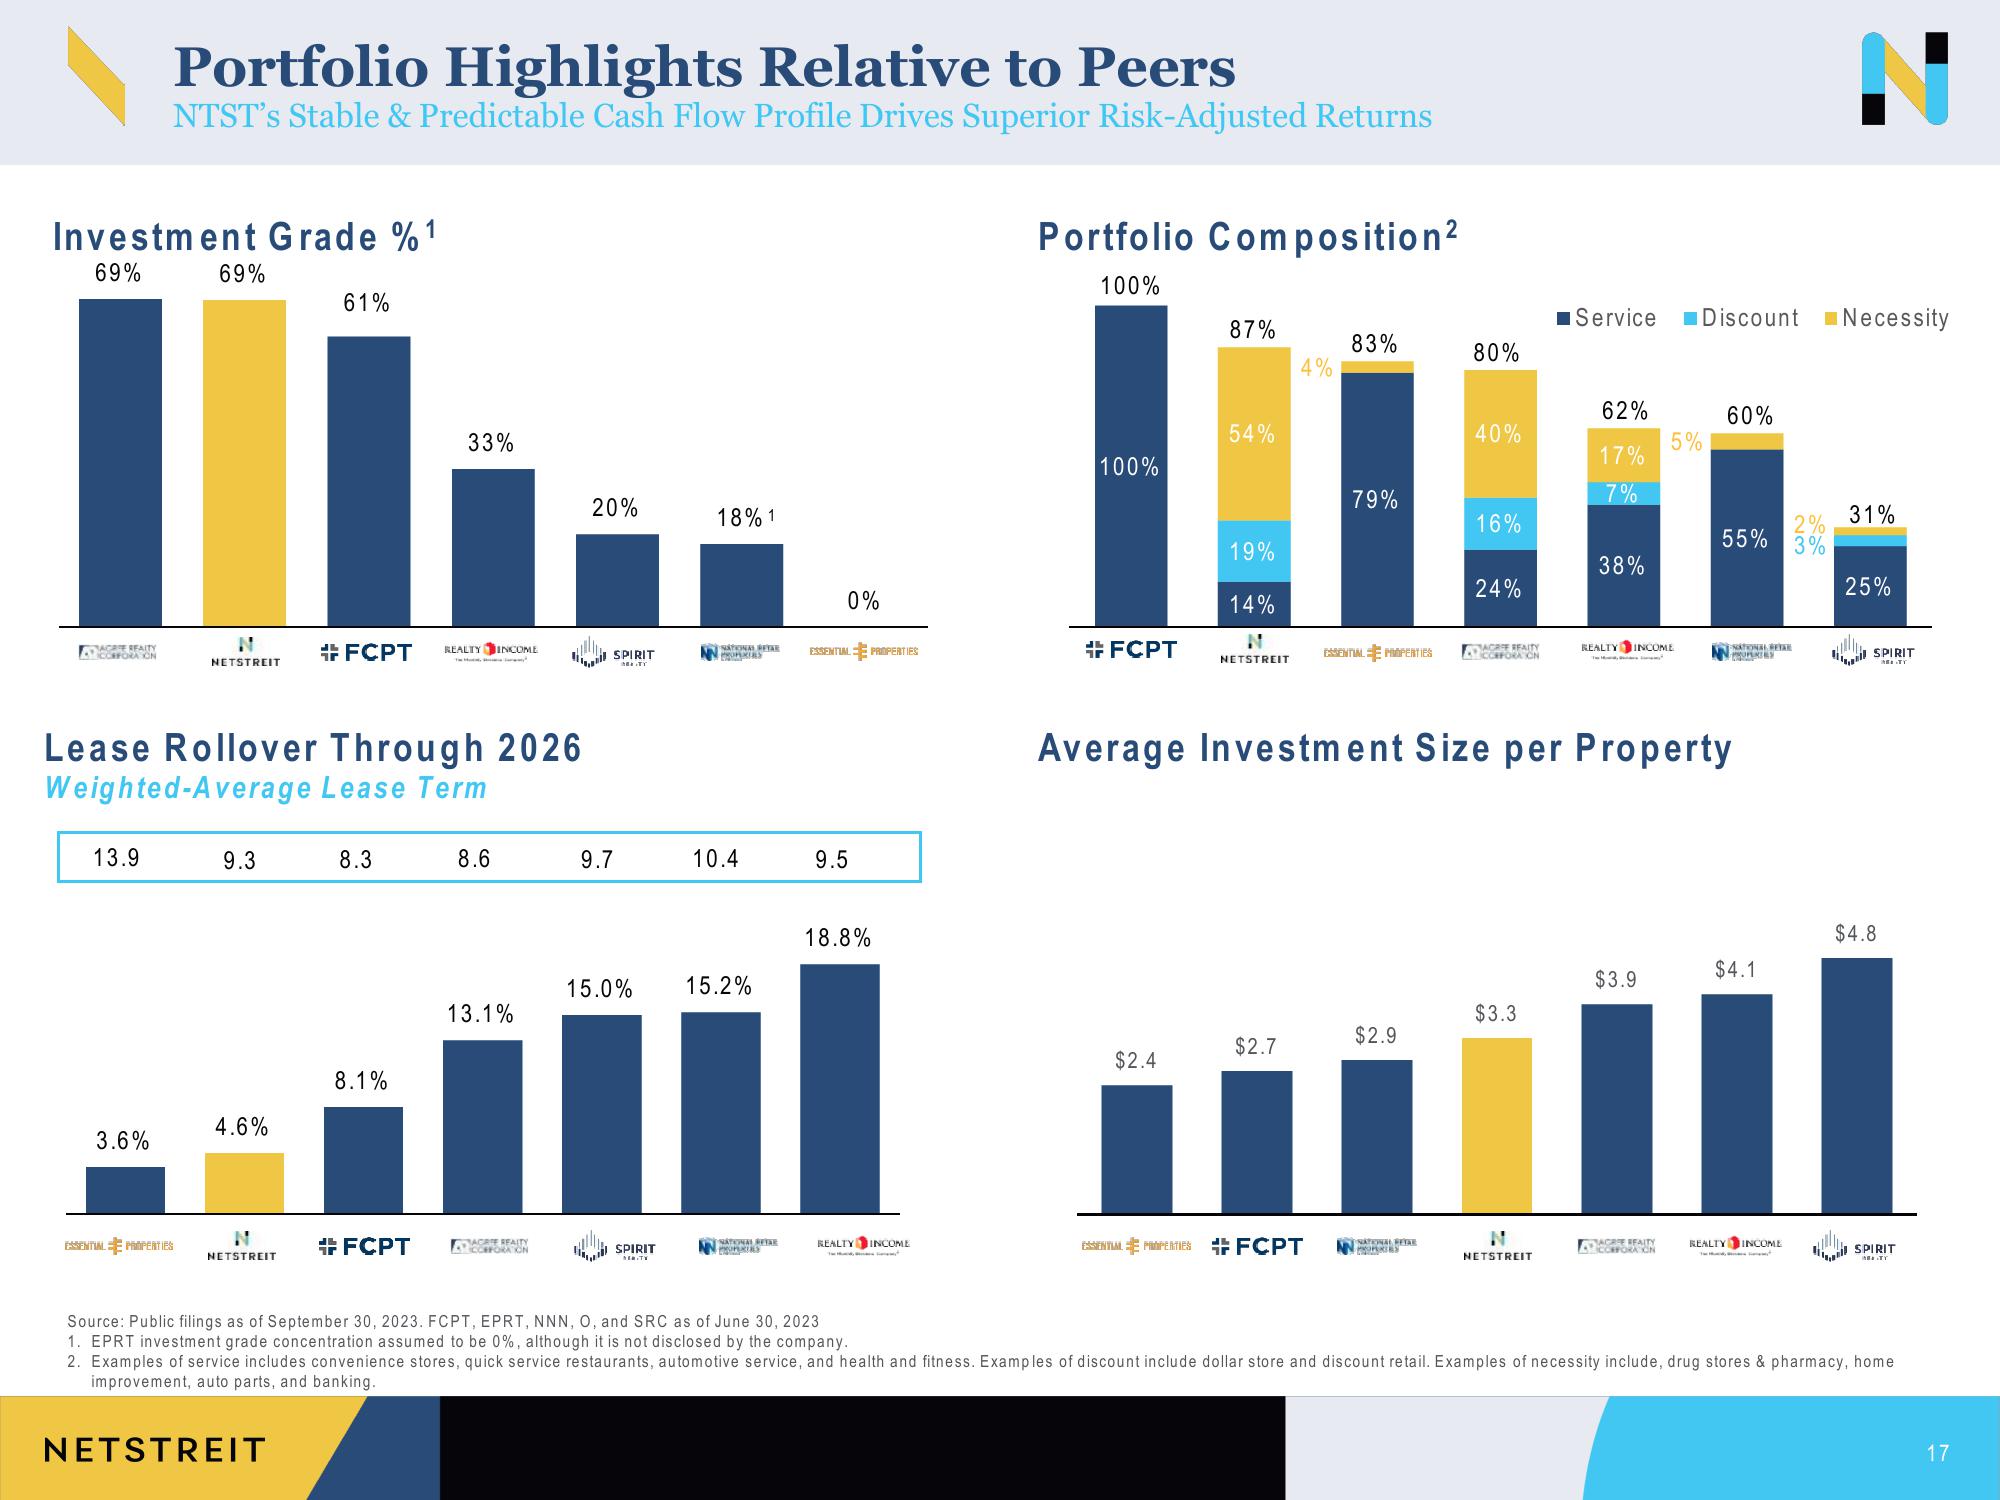
Investment Grade % ¹
69%
69%
III
N
NETSTREIT
REALTY
CORFORA ON
Portfolio Highlights Relative to Peers
NTST's Stable & Predictable Cash Flow Profile Drives Superior Risk-Adjusted Returns
13.9
3.6%
ESSENTIAL PROPERTIES
Lease Rollover Through 2026
Weighted-Average Lease Term
9.3
4.6%
61%
NETSTREIT
#FCPT
8.3
8.1%
33%
#FCPT
REALTY INCOME
8.6
13.1%
AGRIE REALTY
ASTICCEFORA ON
20%
SPIRIT
9.7
15.0%
SPIRIT
SERITE
18% 1
NATIONAL RETAR
NN PROPERIRS
10.4
15.2%
NATIONAL RETAR
PROPERTIES
0%
ESSENTIAL PROPERTIES
9.5
18.8%
REALTY INCOME
Portfolio Composition²
100%
100%
#FCPT
87%
$2.4
54%
19%
14%
N
NETSTREIT
4%
$2.7
83%
ESSENTIAL MIMPERTIES #FCPT
79%
ESSENTIAL HMOPERTIES
$2.9
NN RETAR
80%
PROPERTY
40%
16%
24%
AGREE REAITY
CORPORA ON
$3.3
■Service Discount Necessity
Average Investment Size per Property
N
NETSTREIT
62%
17%
7%
38%
REALTY INCOME
5%
$3.9
AGE REALTY
AT SCORPORATION
60%
2%
55% 3%
NATIONAL RETAR
PROPERTES
$4.1
REALTY INCOME
31%
25%
SPIRIT
MEATY
$4.8
SPIRIT
Source: Public filings as of September 30, 2023. FCPT, EPRT, NNN, O, and SRC as of June 30, 2023
1. EPRT investment grade concentration assumed to be 0%, although it is not disclosed by the company.
2. Examples of service includes convenience stores, quick service restaurants, automotive service, and health and fitness. Examples of discount include dollar store and discount retail. Examples of necessity include, drug stores & pharmacy, home
improvement, auto parts, and banking.
NETSTREIT
17View entire presentation