Avantor Results Presentation Deck
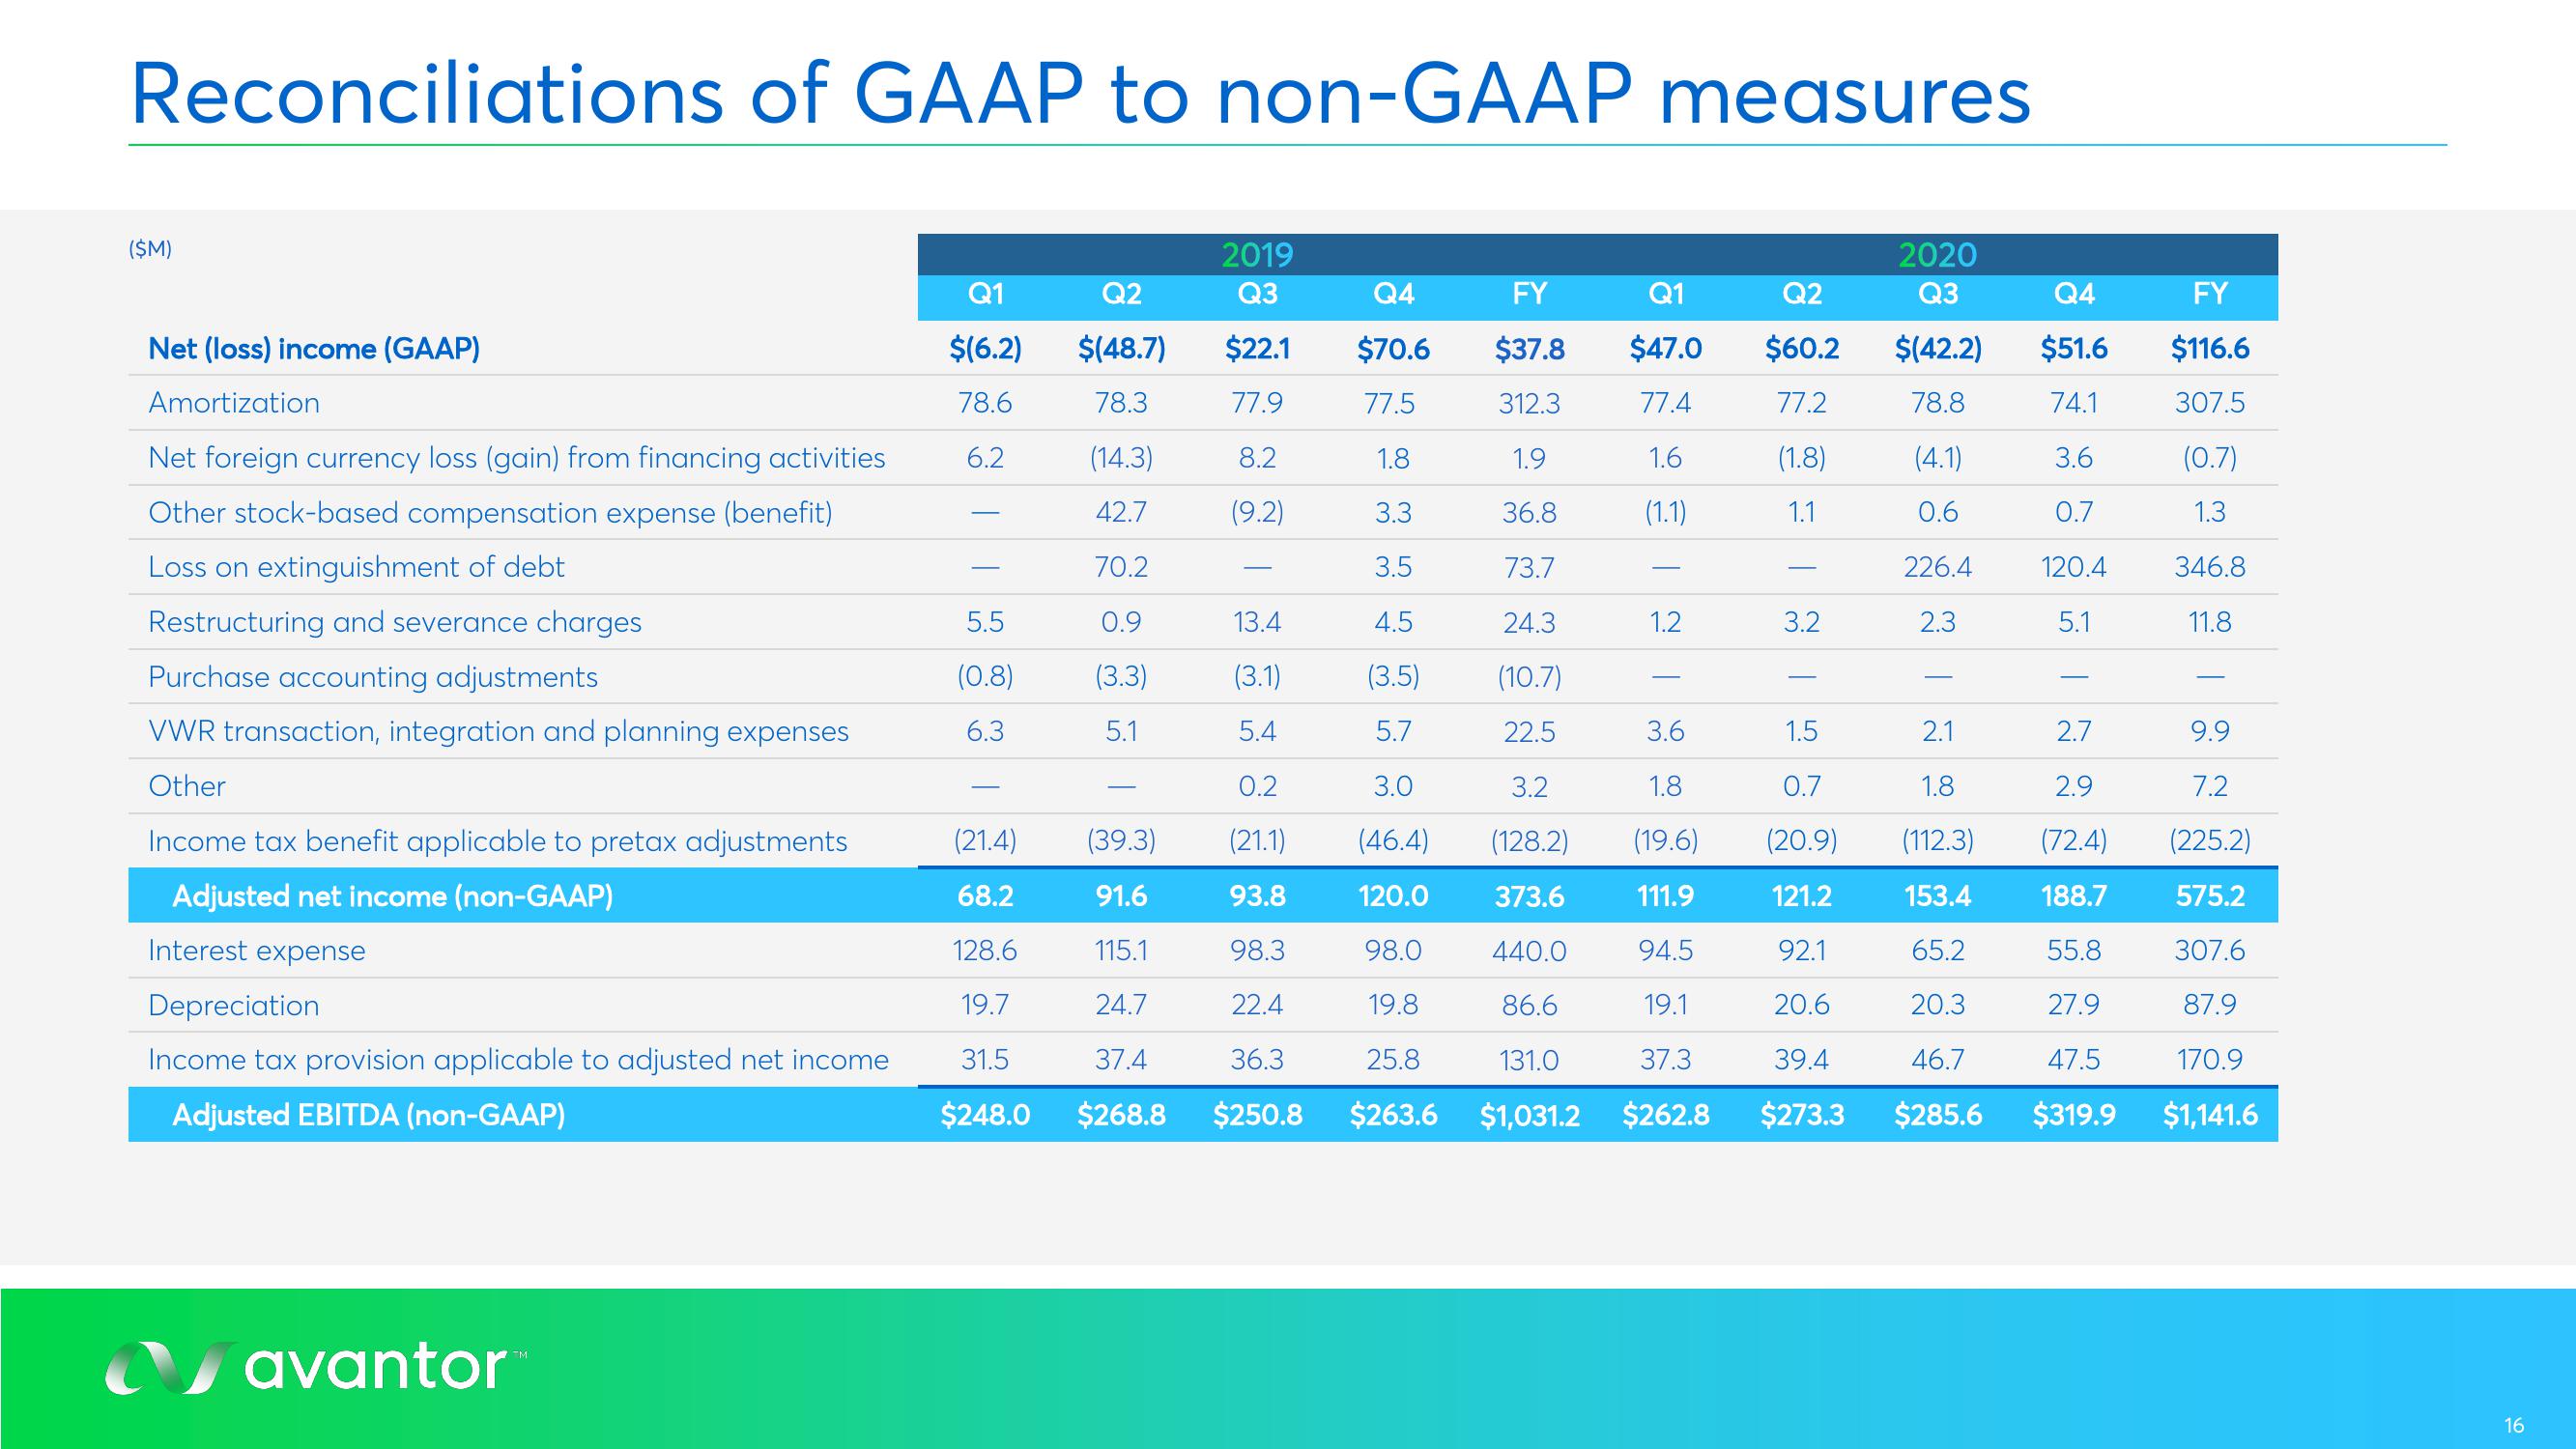
Reconciliations of GAAP to non-GAAP measures
($M)
Net (loss) income (GAAP)
Amortization
Net foreign currency loss (gain) from financing activities
Other stock-based compensation expense (benefit)
Loss on extinguishment of debt
Restructuring and severance charges
Purchase accounting adjustments
VWR transaction, integration and planning expenses
Other
Income tax benefit applicable to pretax adjustments
Adjusted net income (non-GAAP)
Interest expense
Depreciation
Income tax provision applicable to adjusted net income
Adjusted EBITDA (non-GAAP)
avantor
M
Q1
$(6.2)
78.6
6.2
5.5
(0.8)
6.3
(21.4)
68.2
128.6
19.7
31.5
$248.0
Q2
$(48.7)
78.3
(14.3)
42.7
70.2
0.9
(3.3)
5.1
(39.3)
91.6
115.1
24.7
37.4
$268.8
2019
Q3
$22.1
77.9
8.2
(9.2)
Q4
$70.6
77.5
1.8
3.3
3.5
13.4
4.5
(3.1)
(3.5)
5.4
5.7
0.2
3.0
(21.1) (46.4)
93.8
120.0
98.3
98.0
22.4
19.8
36.3
25.8
$250.8 $263.6
Q1
Q2
$47.0 $60.2
77.4
77.2
1.6
(1.8)
(1.1)
1.1
FY
$37.8
312.3
1.9
36.8
73.7
24.3
(10.7)
22.5
3.6
1.5
2.1
3.2
1.8
0.7
1.8
(128.2) (19.6)
(112.3)
(20.9)
121.2
373.6
153.4
111.9
94.5
440.0
92.1
65.2
86.6
19.1
20.6
20.3
131.0
37.3
39.4
46.7
$1,031.2 $262.8 $273.3 $285.6
1.2
T
1
3.2
2020
Q3
$(42.2)
78.8
(4.1)
0.6
226.4
2.3
|
T
Q4
$51.6
74.1
3.6
0.7
120.4
5.1
2.7
2.9
(72.4)
188.7
55.8
27.9
47.5
$319.9
FY
$116.6
307.5
(0.7)
1.3
346.8
11.8
9.9
7.2
(225.2)
575.2
307.6
87.9
170.9
$1,141.6
16View entire presentation