MoneyLion Results Presentation Deck
Another Year of Record Performance
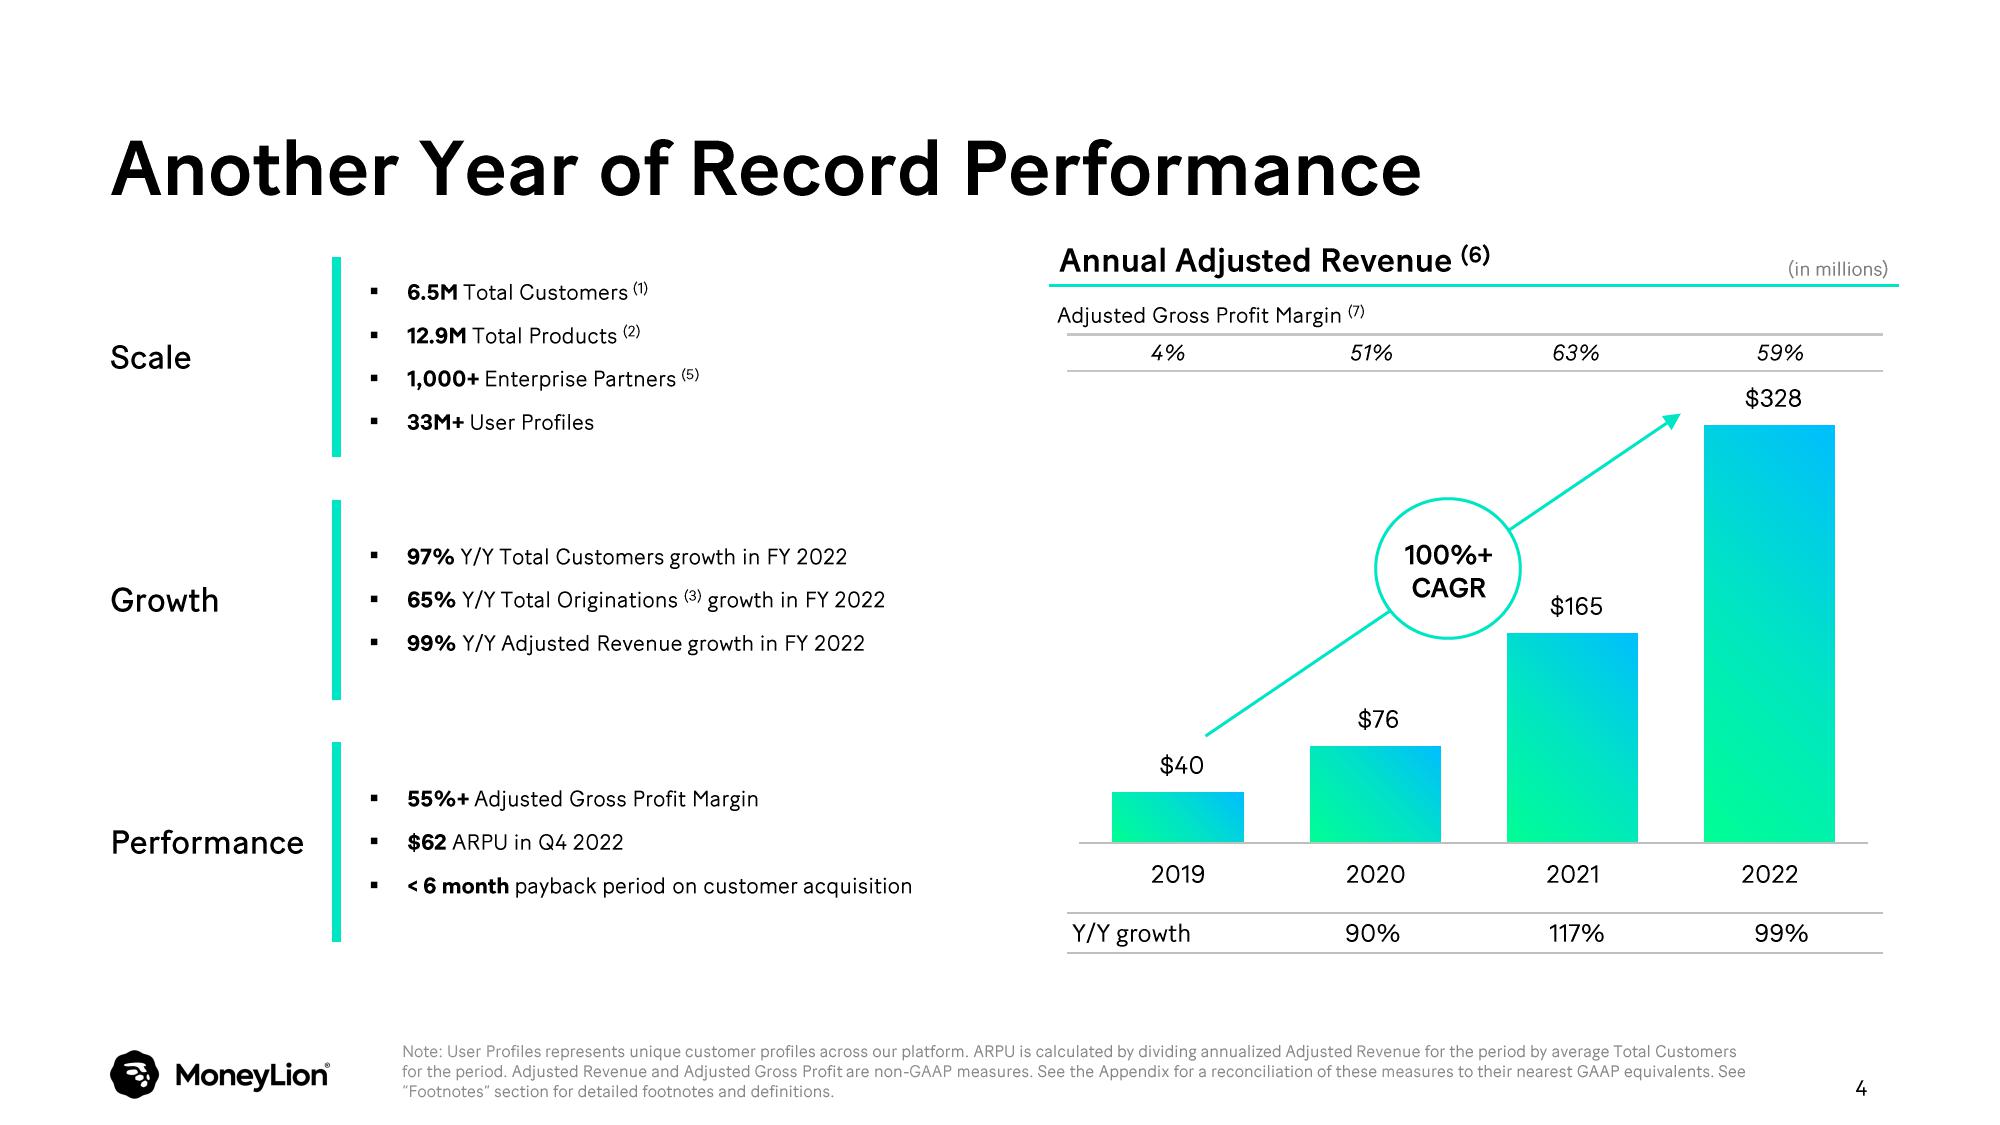
Annual Adjusted Revenue (6)
Adjusted Gross Profit Margin (7)
4%
51%
Scale
Growth
Performance
MoneyLion
■
■
■
I
■
■
■
I
6.5M Total Customers (1)
12.9M Total Products (2)
1,000+ Enterprise Partners (5)
33M+ User Profiles
97% Y/Y Total Customers growth in FY 2022
65% Y/Y Total Originations (3) growth in FY 2022
99% Y/Y Adjusted Revenue growth in FY 2022
55%+ Adjusted Gross Profit Margin
$62 ARPU in Q4 2022
< 6 month payback period on customer acquisition
$40
2019
Y/Y growth
$76
100%+
CAGR
2020
90%
63%
$165
202
117%
(in millions)
59%
$328
2022
Note: User Profiles represents unique customer profiles across our platform. ARPU is calculated by dividing annualized Adjusted Revenue for the period by average Total Customers
for the period. Adjusted Revenue and Adjusted Gross Profit are non-GAAP measures. See the Appendix for a reconciliation of these measures to their nearest GAAP equivalents. See
"Footnotes" section for detailed footnotes and definitions.
99%
4View entire presentation