SoftBank Results Presentation Deck
SVF1
PROGRESS & HIGHLIGHTS
20%
Nuanced Market Rebound
15%
10%
5%
SVF2
0%
LATAM
April
MARKET PERFORMANCE DRIVEN BY SELECT NAMES
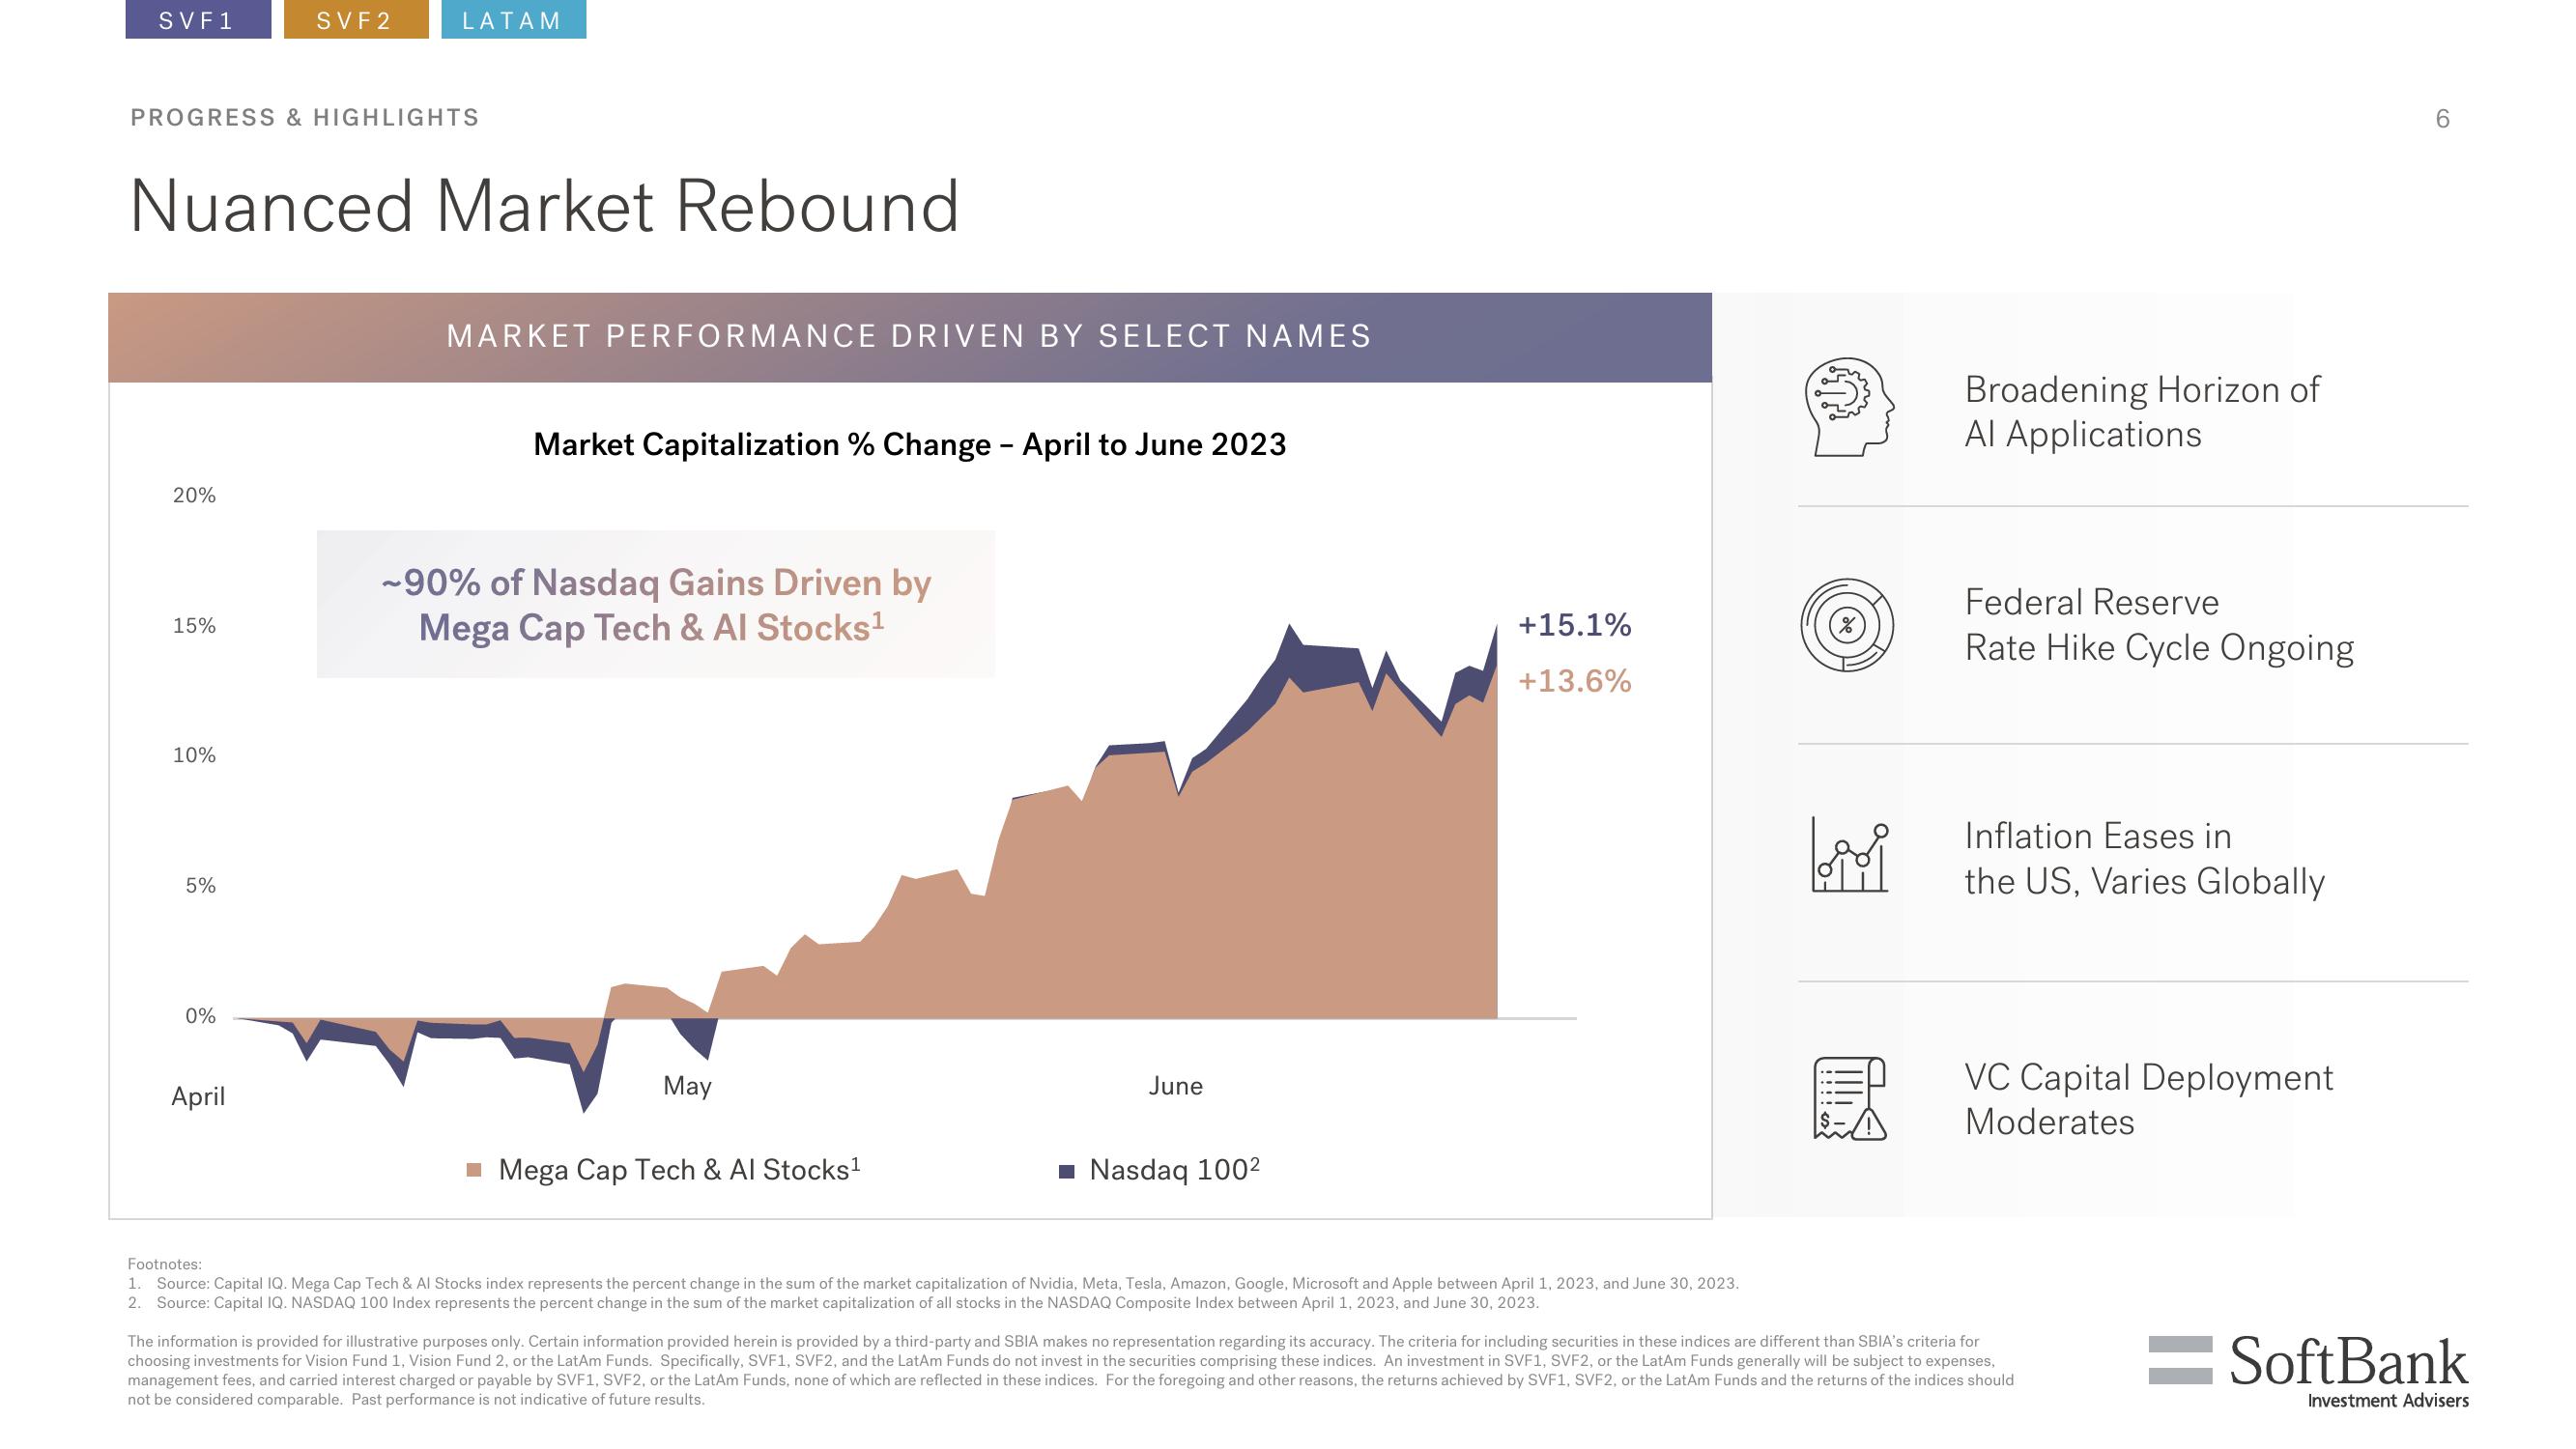
Market Capit ation % Change - April to June 2023
~90% of Nasdaq Gains Driven by
Mega Cap Tech & Al Stocks¹
May
■ Mega Cap Tech & Al Stocks¹
June
■ Nasdaq 100²
+15.1%
+13.6%
Footnotes:
1. Source: Capital IQ. Mega Cap Tech & Al Stocks index represents the percent change in the sum of the market capitalization of Nvidia, Meta, Tesla, Amazon, Google, Microsoft and Apple between April 1, 2023, and June 30, 2023.
2. Source: Capital IQ. NASDAQ 100 Index represents the percent change in the sum of the market capitalization of all stocks in the NASDAQ Composite Index between April 1, 2023, and June 30, 2023.
مه
livi
Broadening Horizon of
Al Applications
Federal Reserve
Rate Hike Cycle Ongoing
Inflation Eases in
the US, Varies Globally
VC Capital Deployment
Moderates
The information is provided for illustrative purposes only. Certain information provided herein is provided by a third-party and SBIA makes no representation regarding its accuracy. The criteria for including securities in these indices are different than SBIA's criteria for
choosing investments for Vision Fund 1, Vision Fund 2, or the LatAm Funds. Specifically, SVF1, SVF2, and the LatAm Funds do not invest in the securities comprising these indices. An investment in SVF1, SVF2, or the LatAm Funds generally will be subject to expenses,
management fees, and carried interest charged or payable by SVF1, SVF2, or the LatAm Funds, none of which are reflected in these indices. For the foregoing and other reasons, the returns achieved by SVF1, SVF2, or the LatAm Funds and the returns of the indices should
not be considered comparable. Past performance is not indicative of future results.
CO
6
=SoftBank
Investment AdvisersView entire presentation