Pathward Financial Results Presentation Deck
FINANCIAL MEASURE RECONCILIATIONS
Efficiency Ratio
($ in thousands)
Noninterest Expense - GAAP
Net Interest Income
Noninterest Income
Total Revenue: GAAP
Efficiency Ratio, LTM
Non-GAAP Reconciliation
Adjusted Annualized NCOs and Adjusted Average Loans and Leases
($ in thousands)
Net Charge-offs
Less: Tax services net charge-offs
Adjusted Net Charge-offs
Quarterly Average Loans and Leases
Less: Quarterly Average Tax Services Loans
Adjusted Quarterly Loans and Leases
Annualized NCOS/Average Loans and Leases
Adjusted Annualized NCOS/Adjusted Average Loans and Leases¹
$
$
Dec 31, 2020
315,828
260,386
247,766
508,152
62.15 %
Dec 31, 2020
2,836
(956)
3,792
3,495,696
25,104
3,470,592
0.32 %
0.44 %
$
For the last twelve months ended
Jun 30, 2020
314,911
Sep 30, 2020
319,051
259,038
239,794
498,832
63.96 %
Sep 30, 2020
18,538
13,034
5.504
For the quarter ended
Jun 30, 2020
$
3,536,997
16,650
$ 3,520,347 $
2.10 %
0.63 %
260,142
235,024
495,166
63.60 %
14,700
9,782
4,918
3,622,928
39,845
3,583,083
$
$
1.62 %
0.55 %
Mar 31, 2020
316,138
264,973
237,766
502,739
62.88 %
Mar 31, 2020
2,117
(74)
2,191
4,195,772
516,491
3,679,281
0.20 %
0.24 %
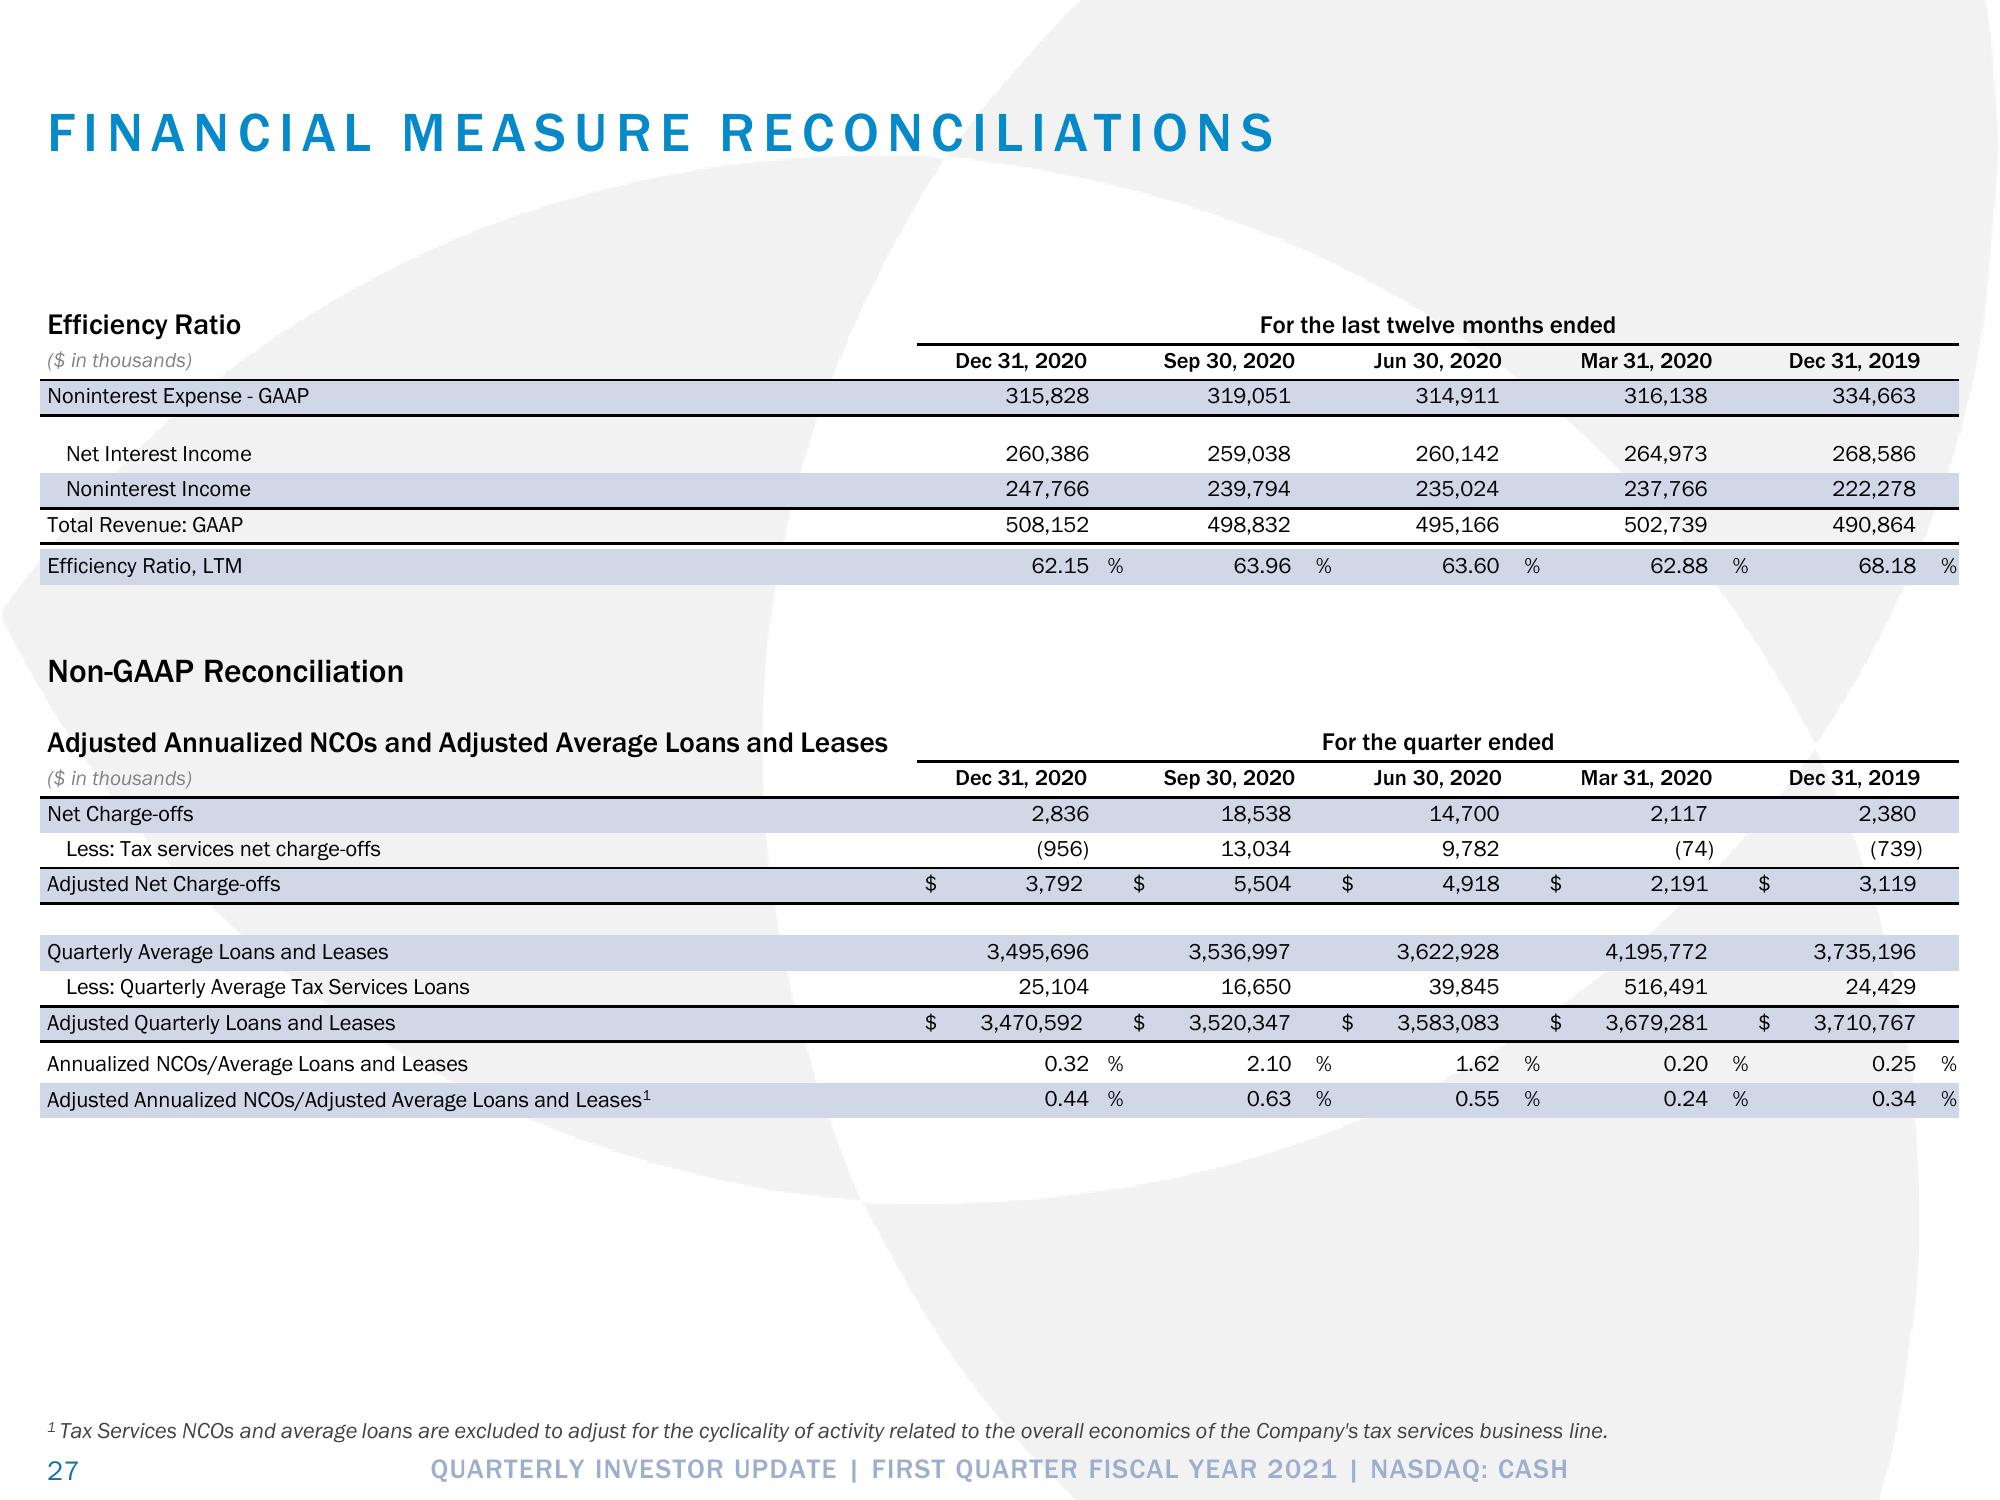
1 Tax Services NCOS and average loans are excluded to adjust for the cyclicality of activity related to the overall economics of the Company's tax services business line.
27
QUARTERLY INVESTOR UPDATE | FIRST QUARTER FISCAL YEAR 2021 | NASDAQ: CASH
$
$
Dec 31, 2019
334,663
268,586
222,278
490,864
68.18
Dec 31, 2019
2,380
(739)
3,119
3,735,196
24,429
3,710,767
%
0.25 %
0.34 %View entire presentation