Dutch Bros Results Presentation Deck
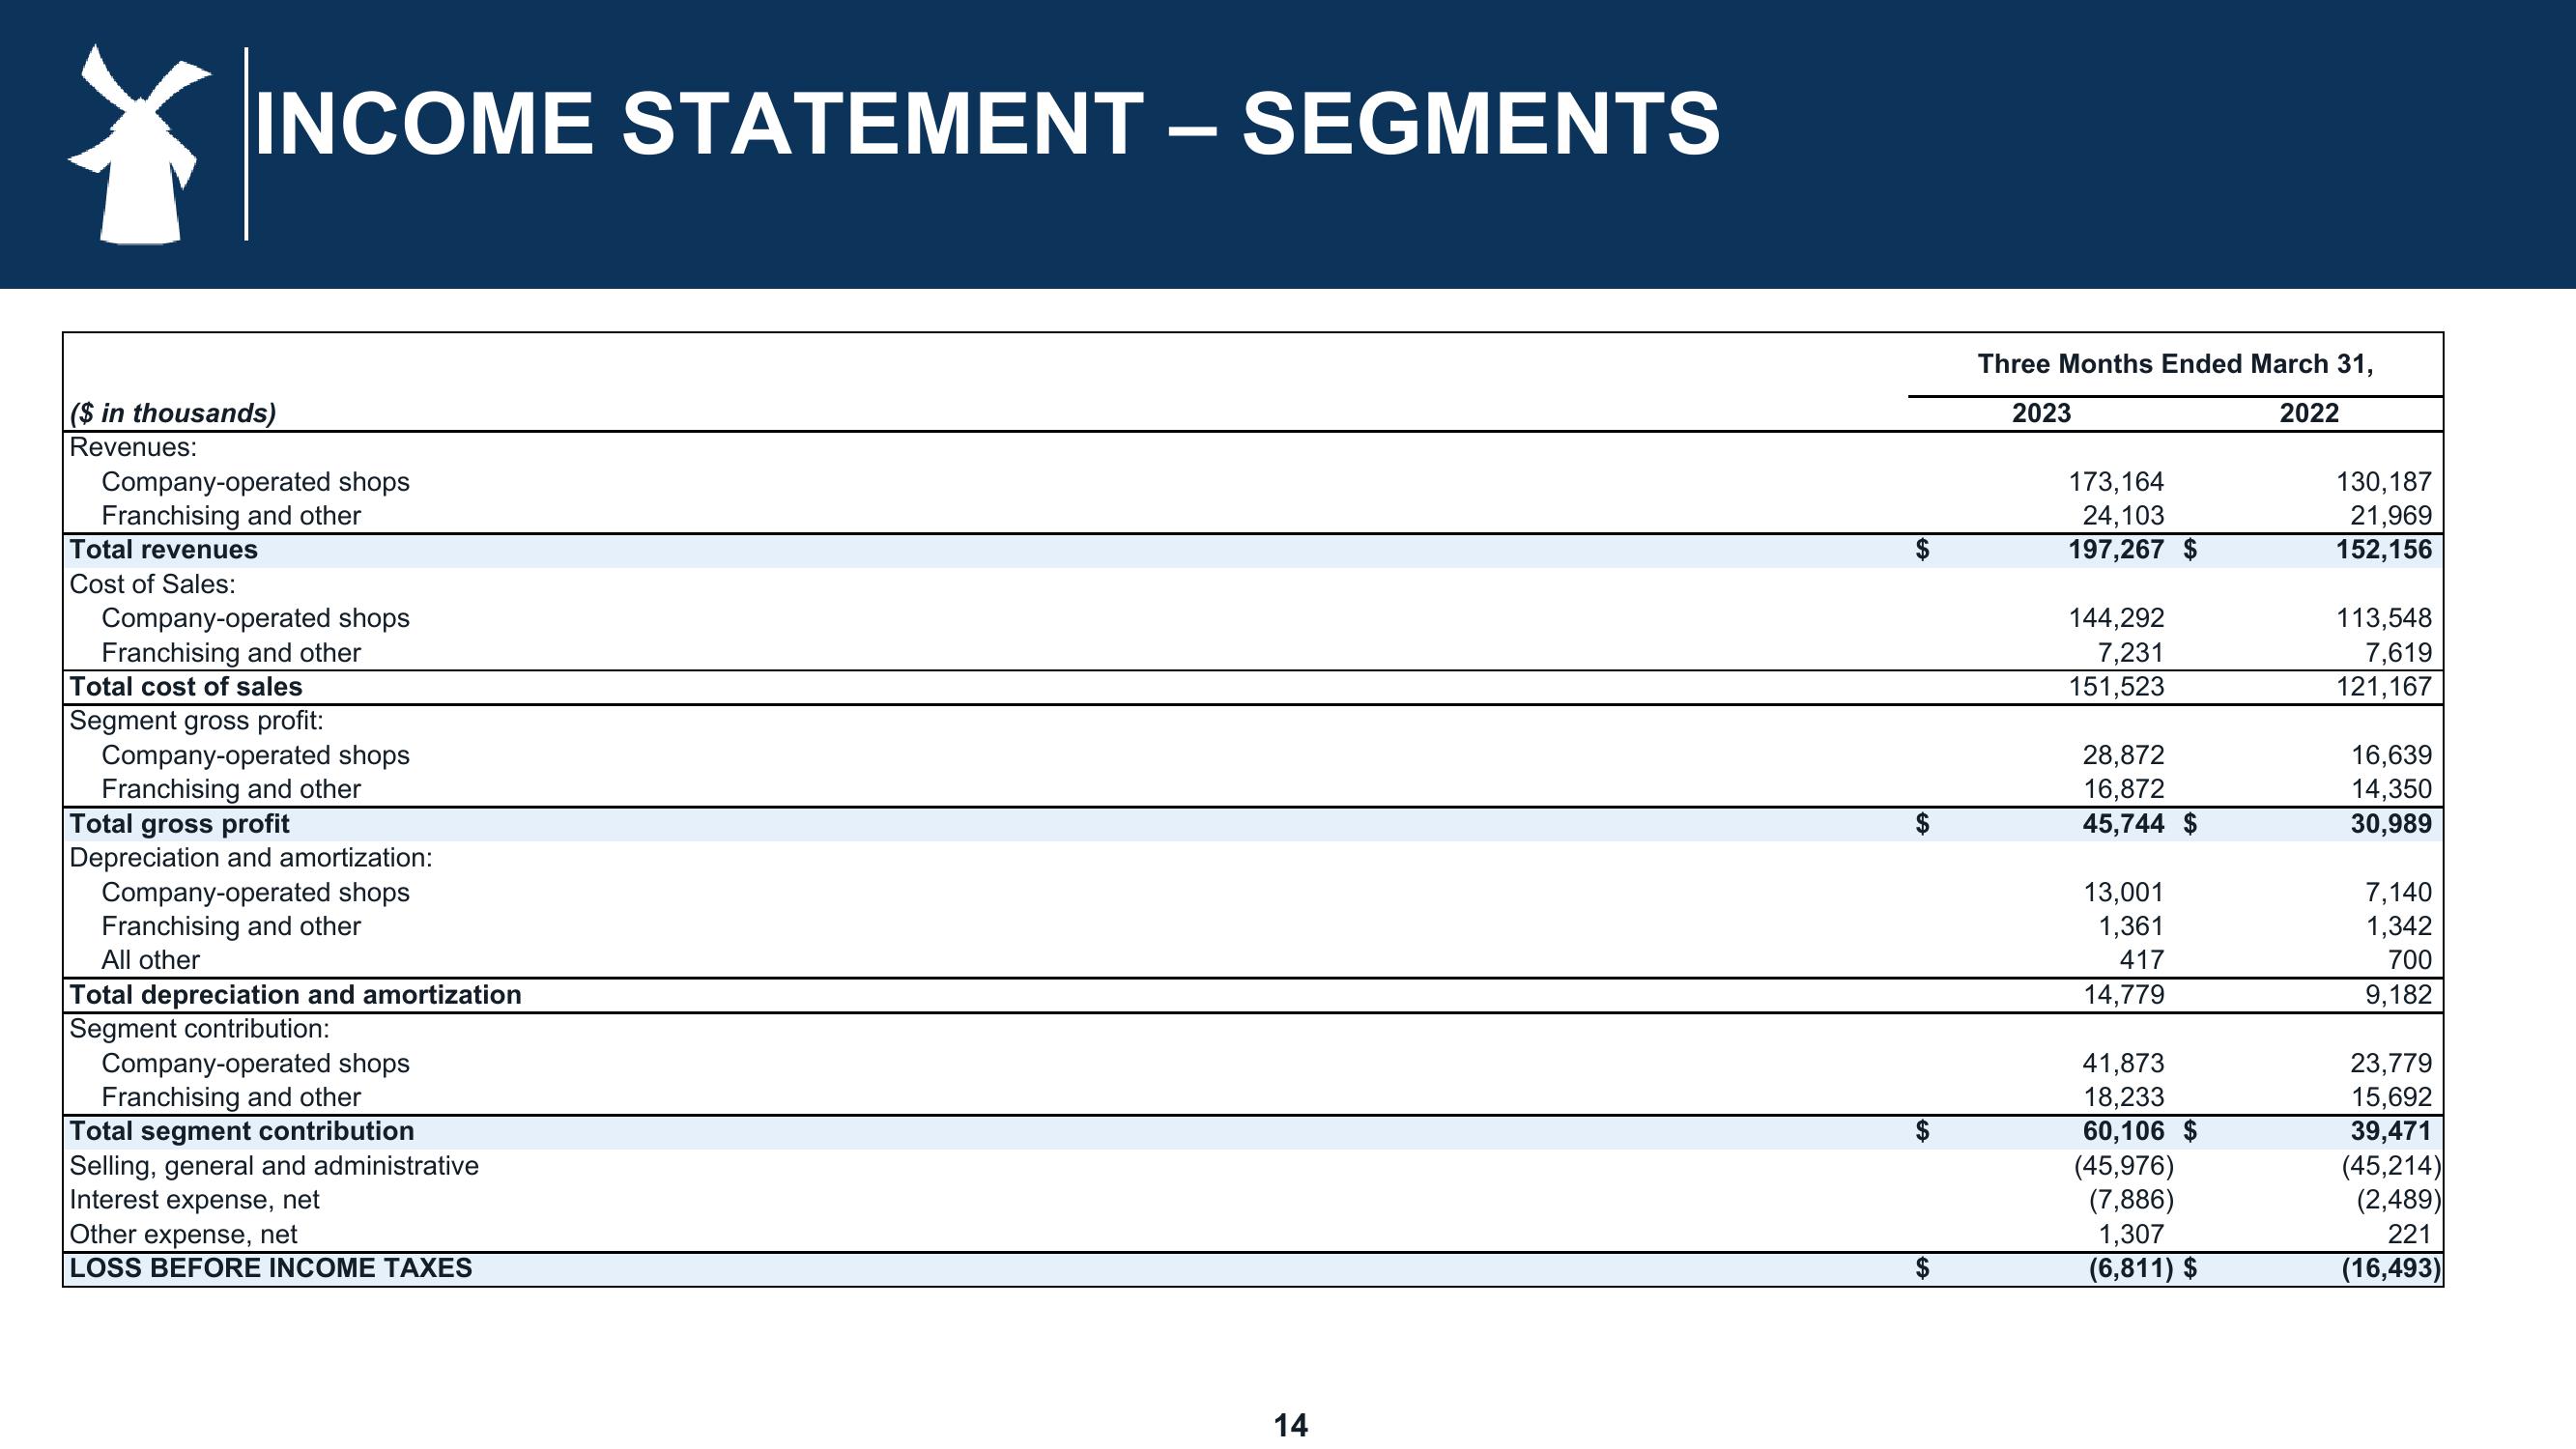
INCOME STATEMENT - SEGMENTS
($ in thousands)
Revenues:
Company-operated shops
Franchising and other
Total revenues
Cost of Sales:
Company-operated shops
Franchising and other
Total cost of sales
Segment gross profit:
Company-operated shops
Franchising and other
Total gross profit
Depreciation and amortization:
Company-operated shops
Franchising and other
All other
Total depreciation and amortization
Segment contribution:
Company-operated shops
Franchising and other
Total segment contribution
Selling, general and administrative
Interest expense, net
Other expense, net
LOSS BEFORE INCOME TAXES
14
Three Months Ended March 31,
2023
2022
173,164
24,103
197,267 $
144,292
7,231
151,523
28,872
16,872
45,744 $
13,001
1,361
417
14,779
41,873
18,233
60,106 $
(45,976)
(7,886)
1,307
(6,811) $
130, 187
21,969
152,156
113,548
7,619
121,167
16,639
14,350
30,989
7,140
1,342
700
9,182
23,779
15,692
39,471
(45,214)
(2,489)
221
(16,493)View entire presentation