Uber Results Presentation Deck
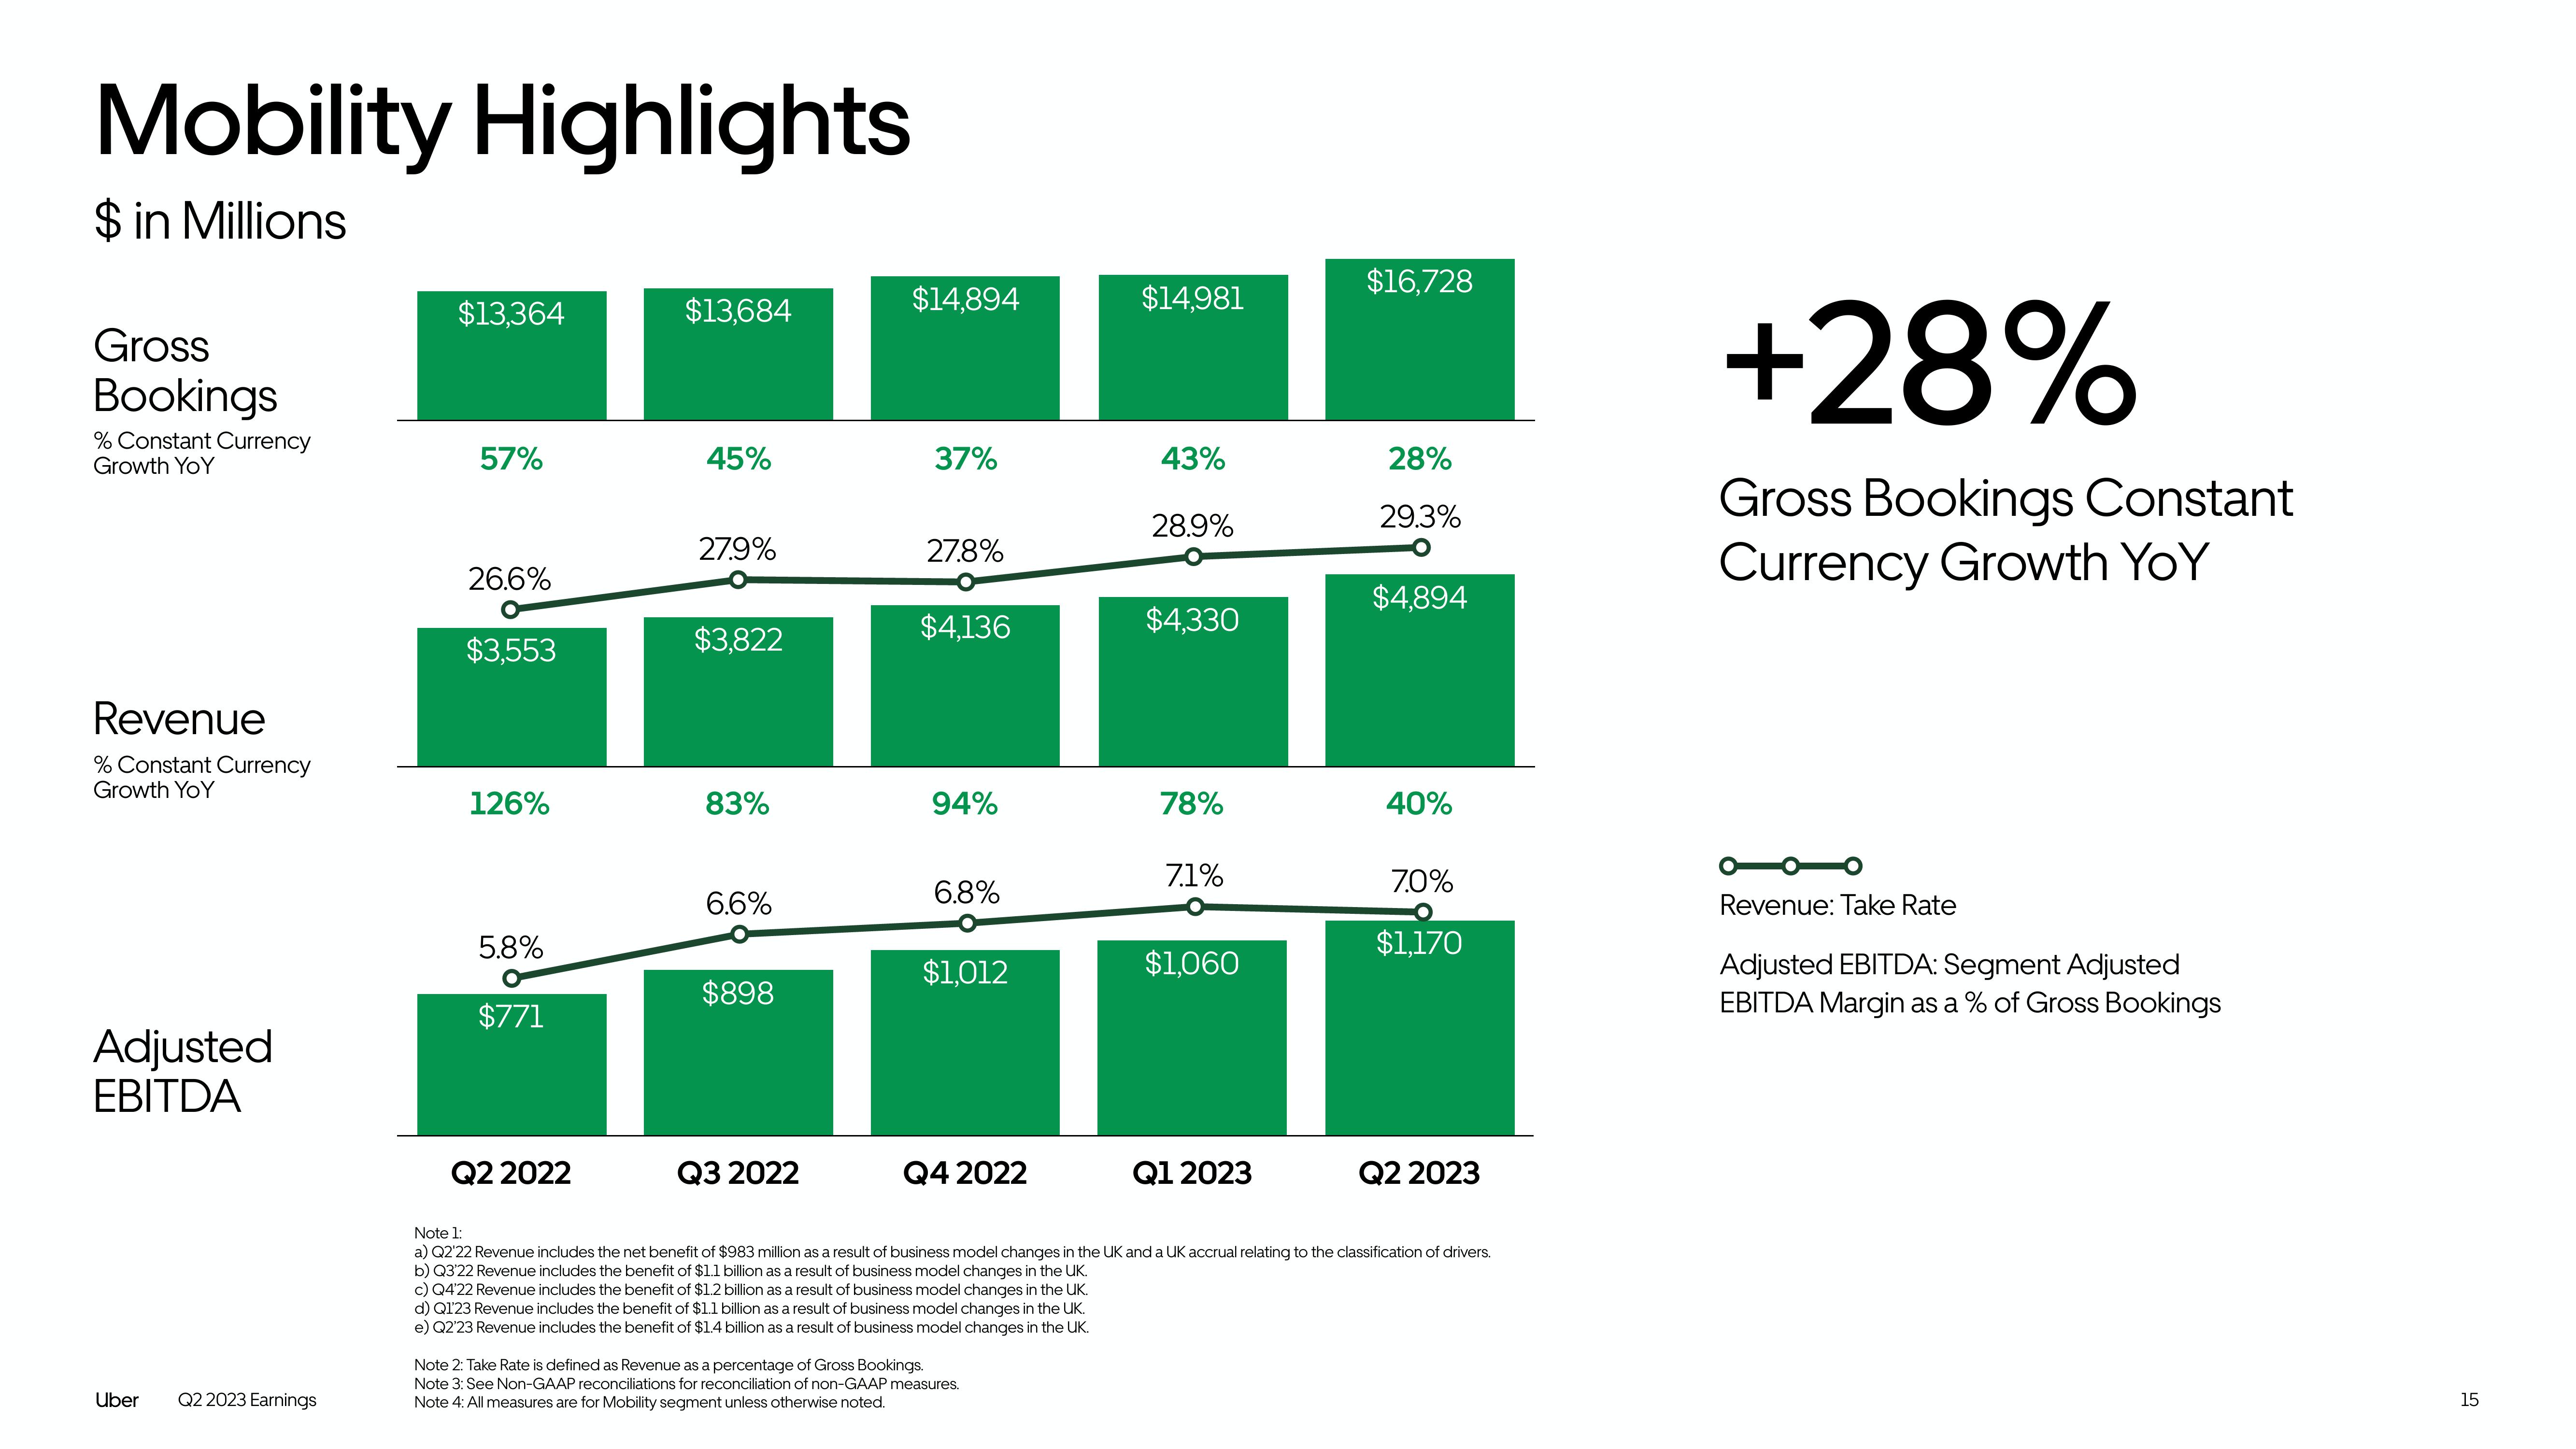
Mobility Highlights
$ in Millions
Gross
Bookings
% Constant Currency
Growth YoY
Revenue
% Constant Currency
Growth YoY
Adjusted
EBITDA
Uber
Q2 2023 Earnings
$13,364
57%
26.6%
O
$3,553
126%
5.8%
$771
Q2 2022
$13,684
45%
27.9%
$3,822
83%
6.6%
$898
Q3 2022
$14,894
37%
27.8%
$4,136
94%
6.8%
$1,012
Q4 2022
$14,981
Note 2: Take Rate is defined as Revenue as a percentage of Gross Bookings.
Note 3: See Non-GAAP reconciliations for reconciliation of non-GAAP measures.
Note 4: All measures are for Mobility segment unless otherwise noted.
43%
28.9%
$4,330
78%
7.1%
$1,060
Q1 2023
$16,728
28%
29.3%
$4,894
40%
7.0%
$1,170
Q2 2023
Note 1:
a) Q2'22 Revenue includes the net benefit of $983 million as a result of business model changes in the UK and a UK accrual relating to the classification of drivers.
b) Q3'22 Revenue includes the benefit of $1.1 billion as a result of business model changes in the UK.
c) Q4'22 Revenue includes the benefit of $1.2 billion as a result of business model changes in the UK.
d) Q1'23 Revenue includes the benefit of $1.1 billion as a result of business model changes in the UK.
e) Q2'23 Revenue includes the benefit of $1.4 billion as a result of business model changes in the UK.
+28%
Gross Bookings Constant
Currency Growth YoY
Revenue: Take Rate
Adjusted EBITDA: Segment Adjusted
EBITDA Margin as a % of Gross Bookings
15View entire presentation