SmileDirectClub Results Presentation Deck slide image

SmileDirectClub Results Presentation Deck

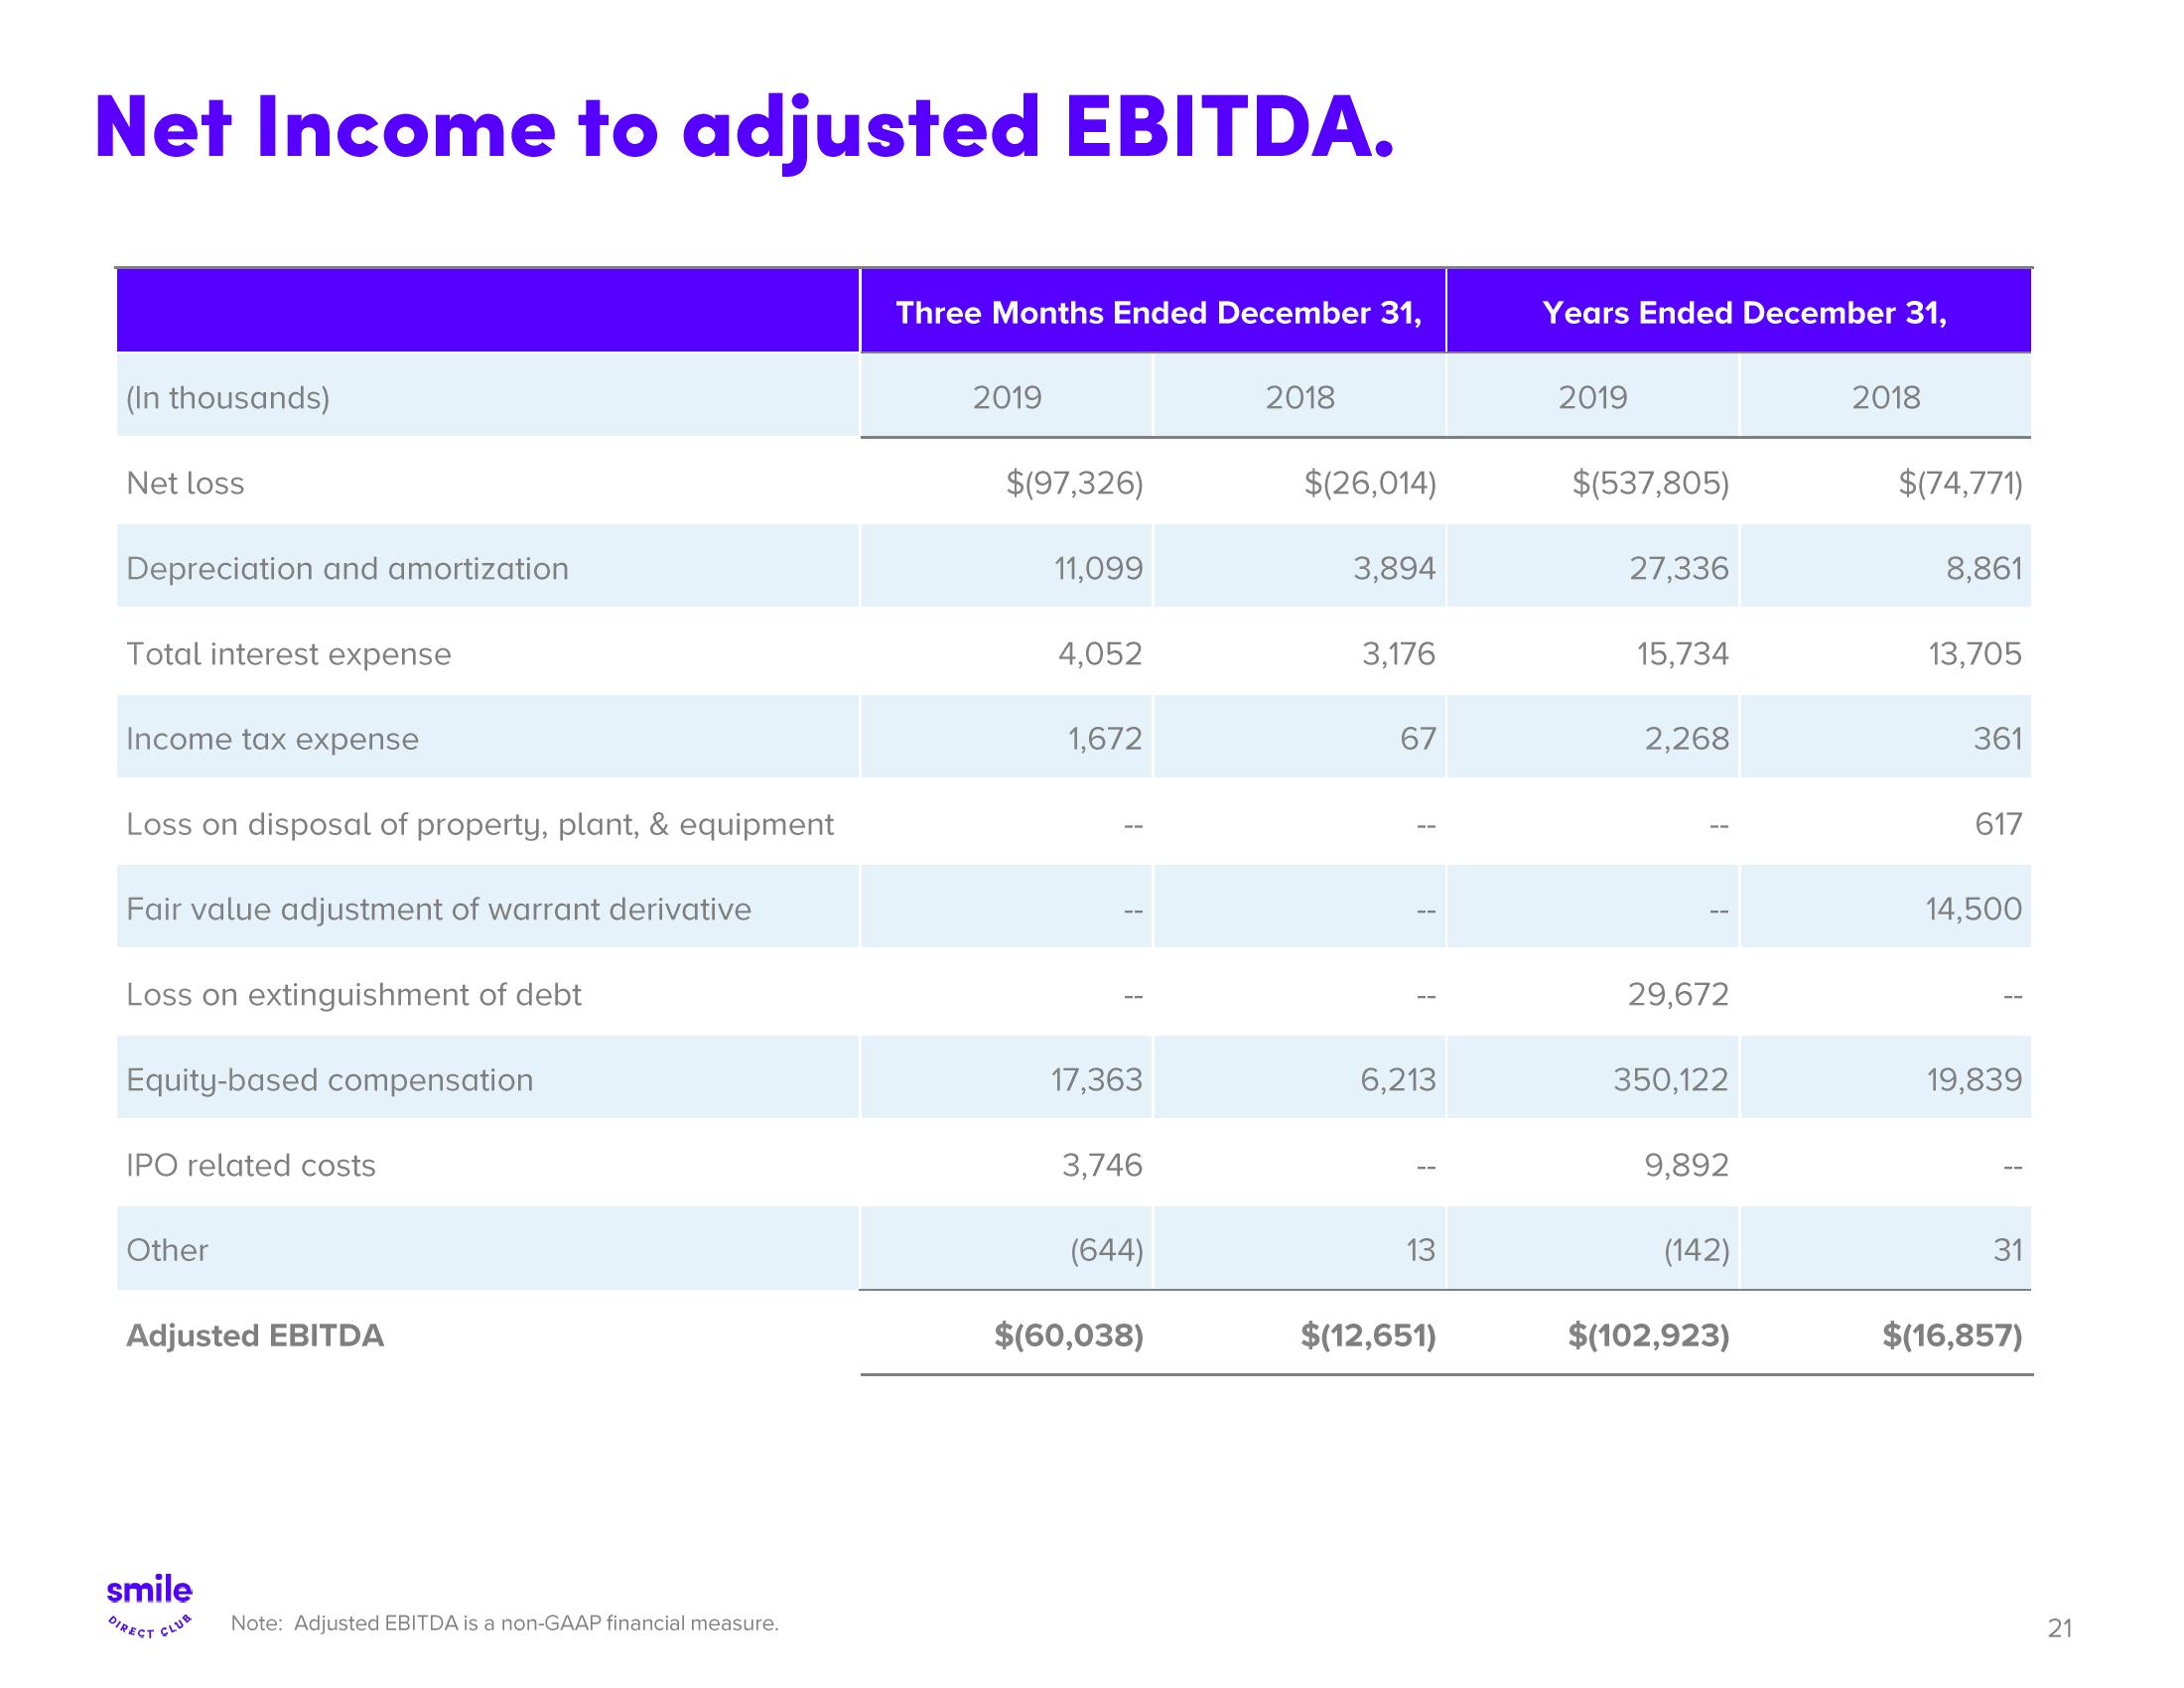
Net Income to adjusted EBITDA. (In thousands) Net loss Depreciation and amortization Total interest expense Income tax expense Loss on disposal of property, plant, & equipment Fair value adjustment of warrant derivative Loss on extinguishment of debt Equity-based compensation IPO related costs Other Adjusted EBITDA smile DIRECT CLUB Note: Adjusted EBITDA is a non-GAAP financial measure. Three Months Ended December 31, 2019 $(97,326) 11,099 4,052 1,672 1 17,363 3,746 (644) $(60,038) 2018 $(26,014) 3,894 3,176 67 1 6,213 13 $(12,651) Years Ended December 31, 2019 $(537,805) 27,336 15,734 2,268 29,672 350,122 9,892 (142) $(102,923) 2018 $(74,771) 8,861 13,705 361 617 14,500 19,839 31 $(16,857) 21
View entire presentation