Rocket Companies Investor Presentation Deck
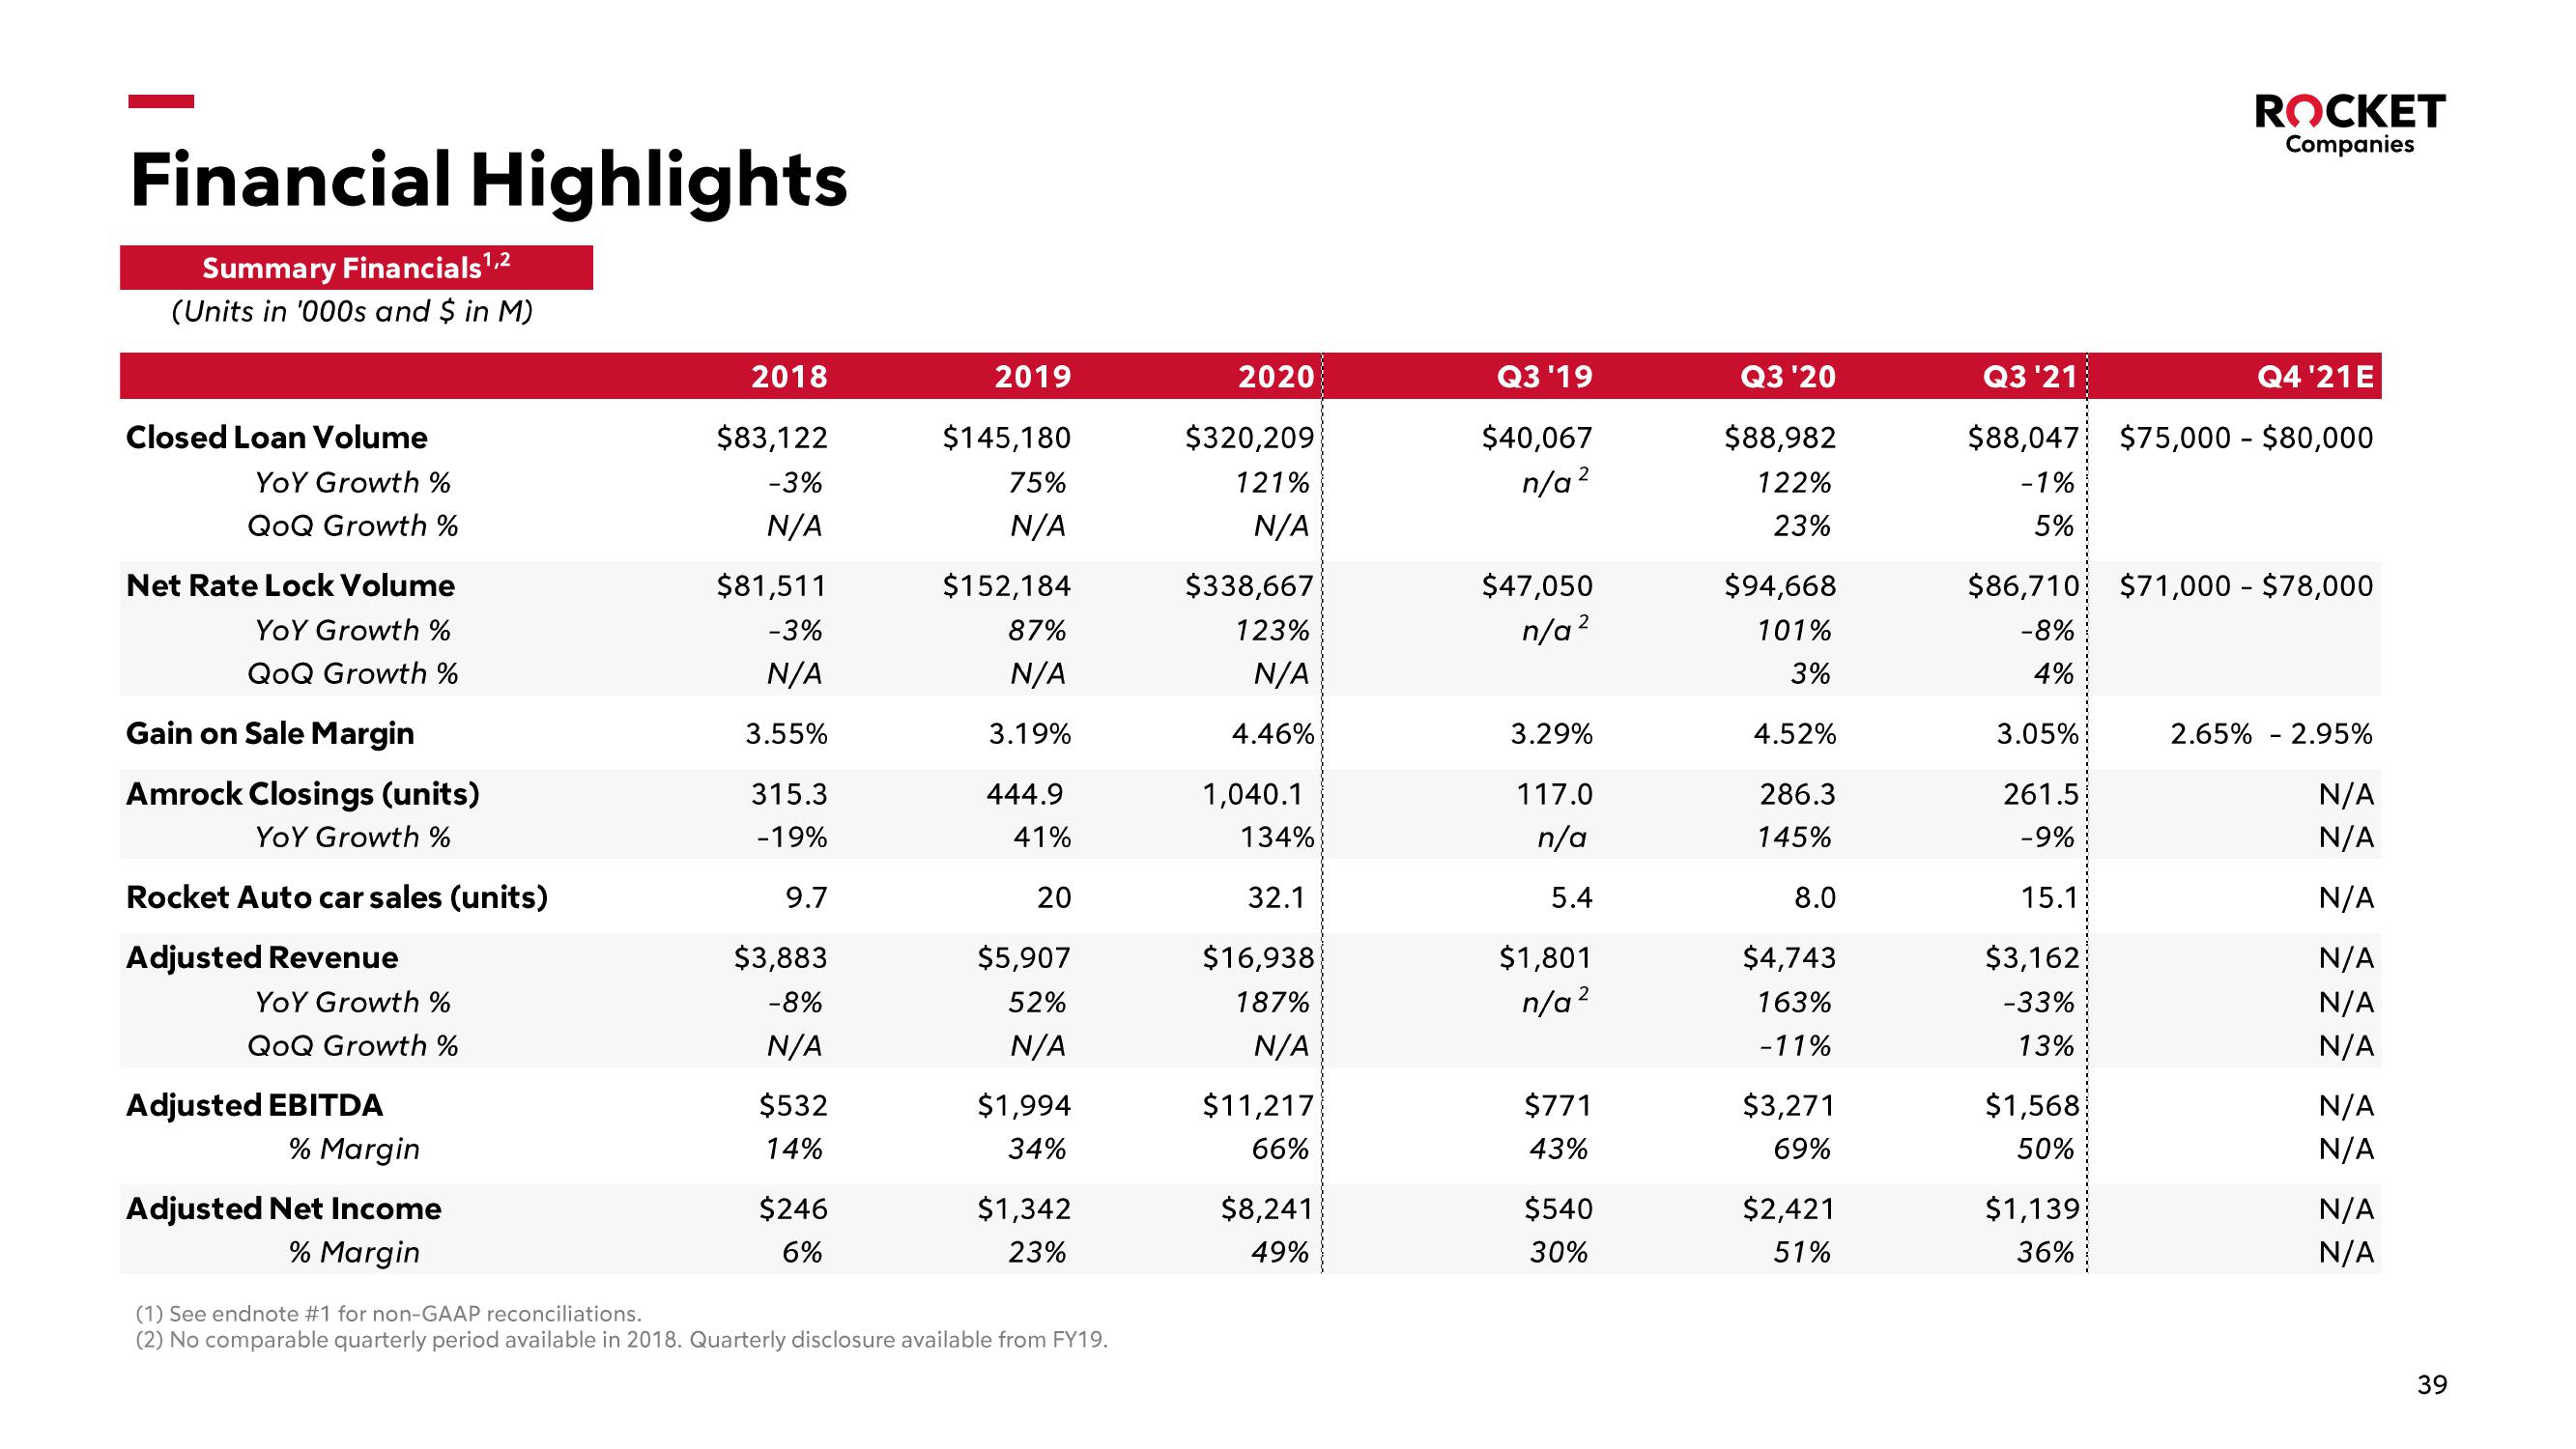
Financial Highlights
Summary Financials ¹,²
(Units in '000s and $ in M)
Closed Loan Volume
YOY Growth %
QoQ Growth %
Net Rate Lock Volume
YOY Growth %
QoQ Growth %
Gain on Sale Margin
Amrock Closings (units)
YOY Growth %
Rocket Auto car sales (units)
Adjusted Revenue
YOY Growth %
QoQ Growth
Adjusted EBITDA
% Margin
Adjusted Net Income
% Margin
2018
$83,122
-3%
N/A
$81,511
-3%
N/A
3.55%
315.3
-19%
9.7
$3,883
-8%
N/A
$532
14%
$246
6%
2019
$145,180
75%
N/A
$152,184
87%
N/A
3.19%
444.9
41%
20
$5,907
52%
N/A
$1,994
34%
$1,342
23%
(1) See endnote #1 for non-GAAP reconciliations.
(2) No comparable quarterly period available in 2018. Quarterly disclosure available from FY19.
2020
$320,209
121%
N/A
$338,667
123%
N/A
4.46%
1,040.1
134%
32.1
$16,938
187%
N/A
$11,217
66%
$8,241
49%
Q3 '19
$40,067
2
n/a ²
$47,050
n/a ²
3.29%
117.0
n/a
5.4
$1,801
2
n/a ²
$771
43%
$540
30%
Q3 '20
$88,982
122%
23%
$94,668
101%
3%
4.52%
286.3
145%
8.0
$4,743
163%
-11%
$3,271
69%
$2,421
51%
Q3 '21
Q4 '21E
$88,047 $75,000 - $80,000
-1%
5%
$86,710 $71,000 - $78,000
-8%
4%
3.05%
261.5
-9%
15.1
$3,162
-33%
13%
ROCKET
Companies
$1,568
50%
$1,139
36%
2.65% 2.95%
N/A
N/A
N/A
N/A
N/A
N/A
N/A
N/A
N/A
N/A
39View entire presentation