Sonder Investor Presentation Deck
Non-GAAP Reconciliations
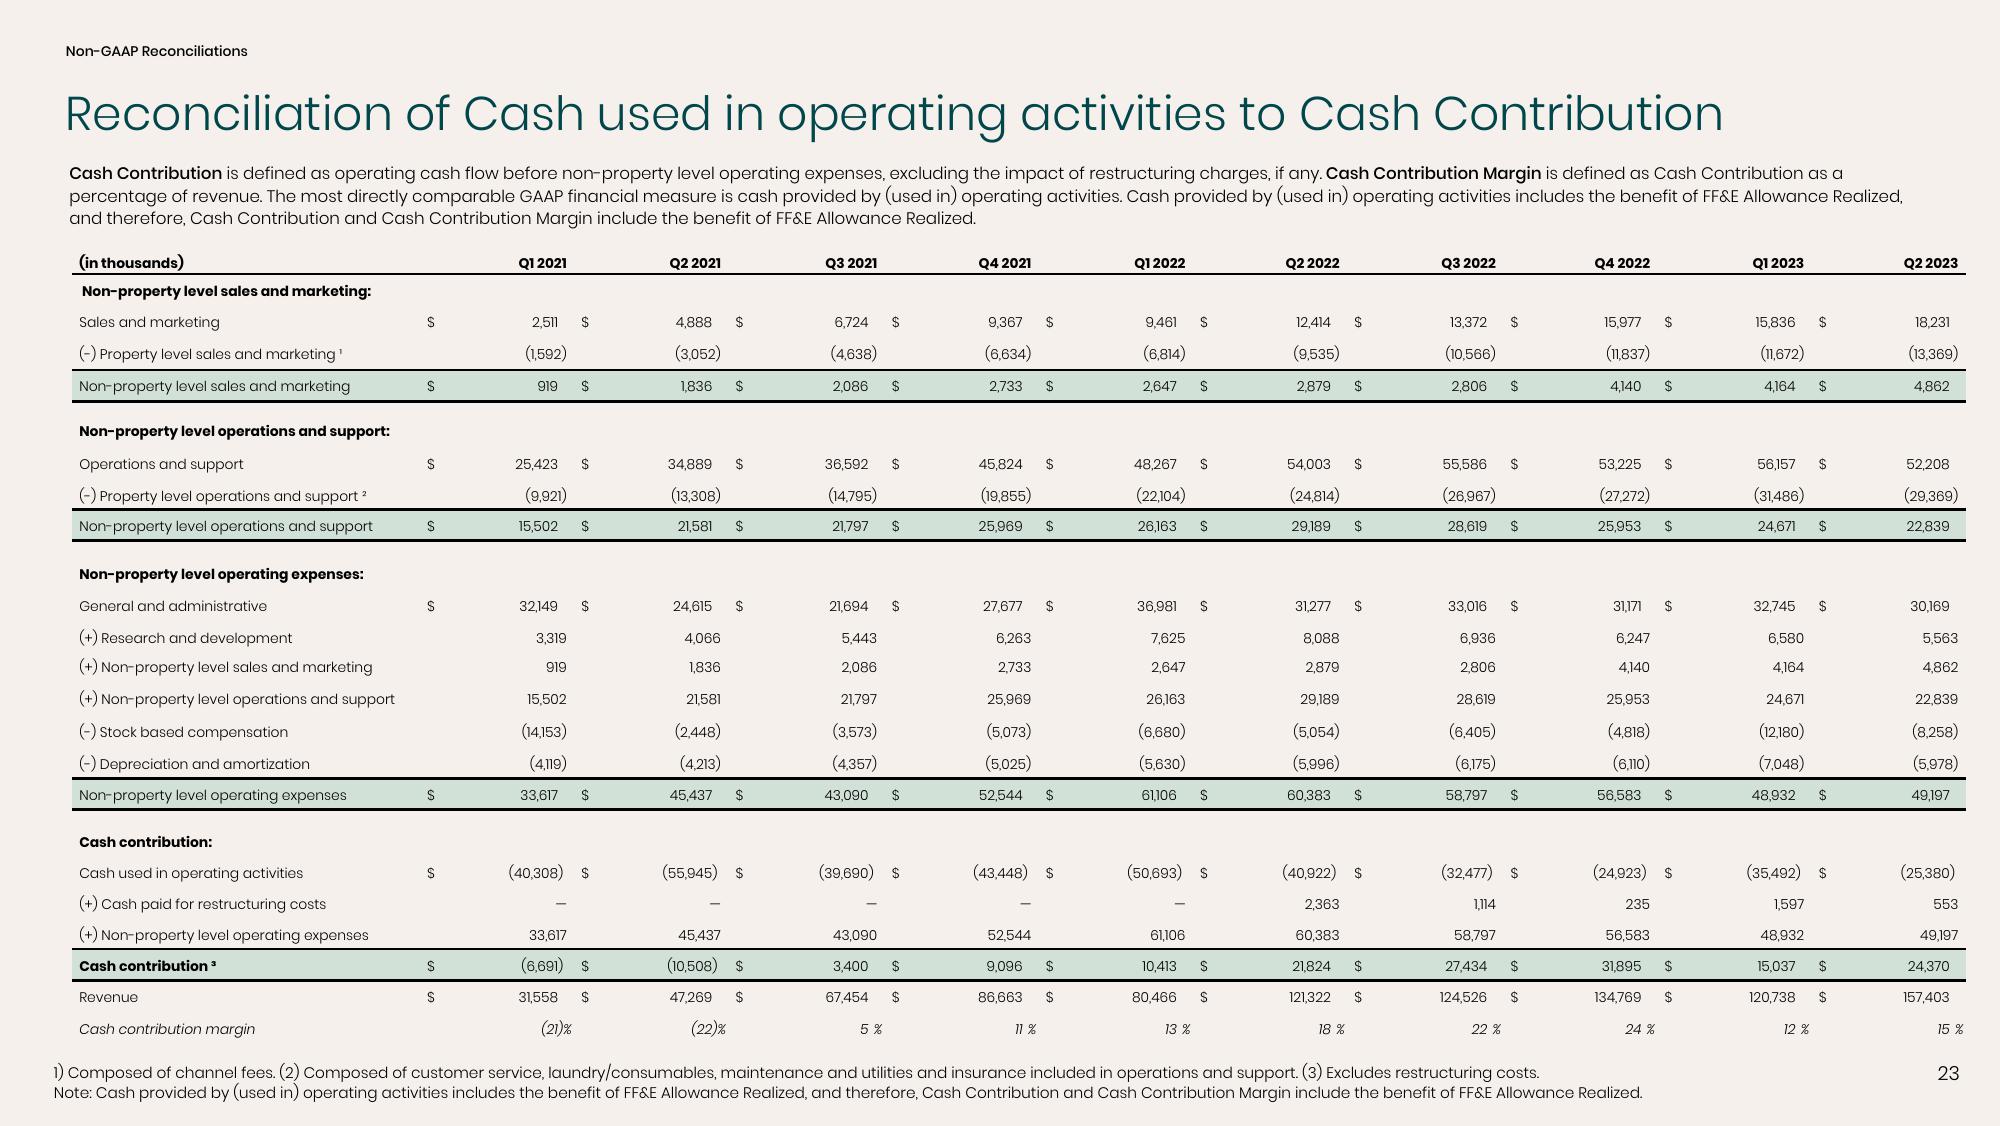
Reconciliation of Cash used in operating activities to Cash Contribution
Cash Contribution is defined as operating cash flow before non-property level operating expenses, excluding the impact of restructuring charges, if any. Cash Contribution Margin is defined as Cash Contribution as a
percentage of revenue. The most directly comparable GAAP financial measure is cash provided by (used in) operating activities. Cash provided by (used in) operating activities includes the benefit of FF&E Allowance Realized,
and therefore, Cash Contribution and Cash Contribution Margin include the benefit of FF&E Allowance Realized.
(in thousands)
Non-property level sales and marketing:
Sales and marketing
(-) Property level sales and marketing¹
Non-property level sales and marketing
Non-property level operations and support:
Operations and support
(-) Property level operations and support ²
Non-property level operations and support
Non-property level operating expenses:
General and administrative
(+) Research and development
(+) Non-property level sales and marketing
(+) Non-property level operations and support
(-) Stock based compensation
(-) Depreciation and amortization
Non-property level operating expenses
Cash contribution:
Cash used in operating activities
(+) Cash paid for restructuring costs
(+) Non-property level operating expenses
Cash contribution ³
Revenue
S
S
S
S
S
S
S
S
S
Q1 2021
2,511
(1,592)
919
25,423
32,149
3,319
919
$
(9,921)
15,502 $
15.502
$
$
$
(14,153)
(4,119)
33,617 $
(40,308) $
33,617
(6,691) $
31,558 $
(21)%
Q2 2021
4,888
(3,052)
1,836
24,615
$
34,889
(13,308)
21,581 $
4,066
1,836
$
$
$
21,581
(2,448)
(4,213)
45,437 $
(55,945) $
45,437
(10,508) $
47,269 $
(22)%
Q3 2021
6,724
(4,638)
2,086 $
36,592
(14,795)
21,797
21,694
5,443
2,086
21,797
(3,573)
(4,357)
43,090
43,090
$
3,400
$
$
(39,690) $
5%
$
$
$
67,454 $
Q4 2021
9,367
(6,634)
2,733 $
45,824 $
(19,855)
25,969 $
27,677
$
6,263
2,733
$
25,969
(5,073)
(5,025)
52,544 $
(43,448) $
52,544
9,096 $
86,663 $
11%
Q1 2022
9,461
(6,814)
2,647
36,981
48,267 S
(22,104)
26,163
7,625
2,647
26,163
(6,680)
(5,630)
61,106
S
61,106
S
$
13 %
S
(50,693) S
S
10,413 $
80,466 S
Q2 2022
12,414
(9,535)
2,879
31,277
8,088
2,879
54,003
(24,814)
29,189 $
$
2,363
$
60,383
$
29,189
(5,054)
(5,996)
60,383 $
(40,922) $
$
18 %
21,824 $
121,322 $
Q3 2022
13,372
(10,566)
2,806
55,586
(26,967)
28,619
33,016
6,936
2,806
28,619
(6,405)
(6,175)
58,797
1,114
58,797
27,434
124,526
$
$
(32,477) $
22 %
$
$
$
$
$
$
Q4 2022
15,977
(11,837)
4,140
31,171
53,225 $
(27,272)
25,953
6,247
4,140
25,953
(4,818)
(6,110)
56,583
Cash contribution margin
1) Composed of channel fees. (2) Composed of customer service, laundry/consumables, maintenance and utilities and insurance included in operations and support. (3) Excludes restructuring costs.
Note: Cash provided by (used in) operating activities includes the benefit of FF&E Allowance Realized, and therefore, Cash Contribution and Cash Contribution Margin include the benefit of FF&E Allowance Realized.
235
56,583
31,895
134,769
$
$
(24,923) $
24 %
$
$
$
$
$
Q1 2023
15,836
(11,672)
4,164
56,157
(31,486)
24,671
32,745
6,580
4,164
24,671
(12,180)
(7,048)
48,932
48,932
15,037
120,738
$
12 %
$
$
$
(35,492) $
1,597
$
$
$
$
Q2 2023
18,231
(13,369)
4,862
52,208
(29,369)
22,839
30,169
5,563
4,862
22,839
(8,258)
(5,978)
49,197
(25,380)
553
49,197
24,370
157,403
15 %
23View entire presentation