Bank of America Results Presentation Deck
Global Wealth & Investment Management
Summary Income Statement ($MM)
Total revenue, net of interest expense
Provision (benefit) for credit losses
Noninterest expense
Pretax income
Pretax, pre-provision income¹
Income tax expense
Net income
Key Indicators ($B)
Average deposits
Rate paid on deposits
Average loans and leases
Net charge-off ratio
Net charge-offs ($MM)
Reserve build (release) ($MM)
AUM flows
Pretax margin
Return on average allocated capital
Allocated capital
All
3Q22
$5,429
37
3,816
1,576
1,613
386
$1,190
3Q22
$339.5
0.57 %
$223.7
0.01 %
$5
32
$4.1
29 %
27
$17.5
Inc / (Dec)
2Q22
($4)
4
(59)
51
55
12
$39
2Q22
$363.9
0.11 %
$219.3
0.02 %
$9
24
$1.0
28 %
26
$17.5
3Q21
$119
95
72
(48)
47
(12)
($36)
3Q21
$339.4
0.03 %
$199.7
0.01 %
$7
(65)
$14.8
31 %
30
$16.5
.
.
.
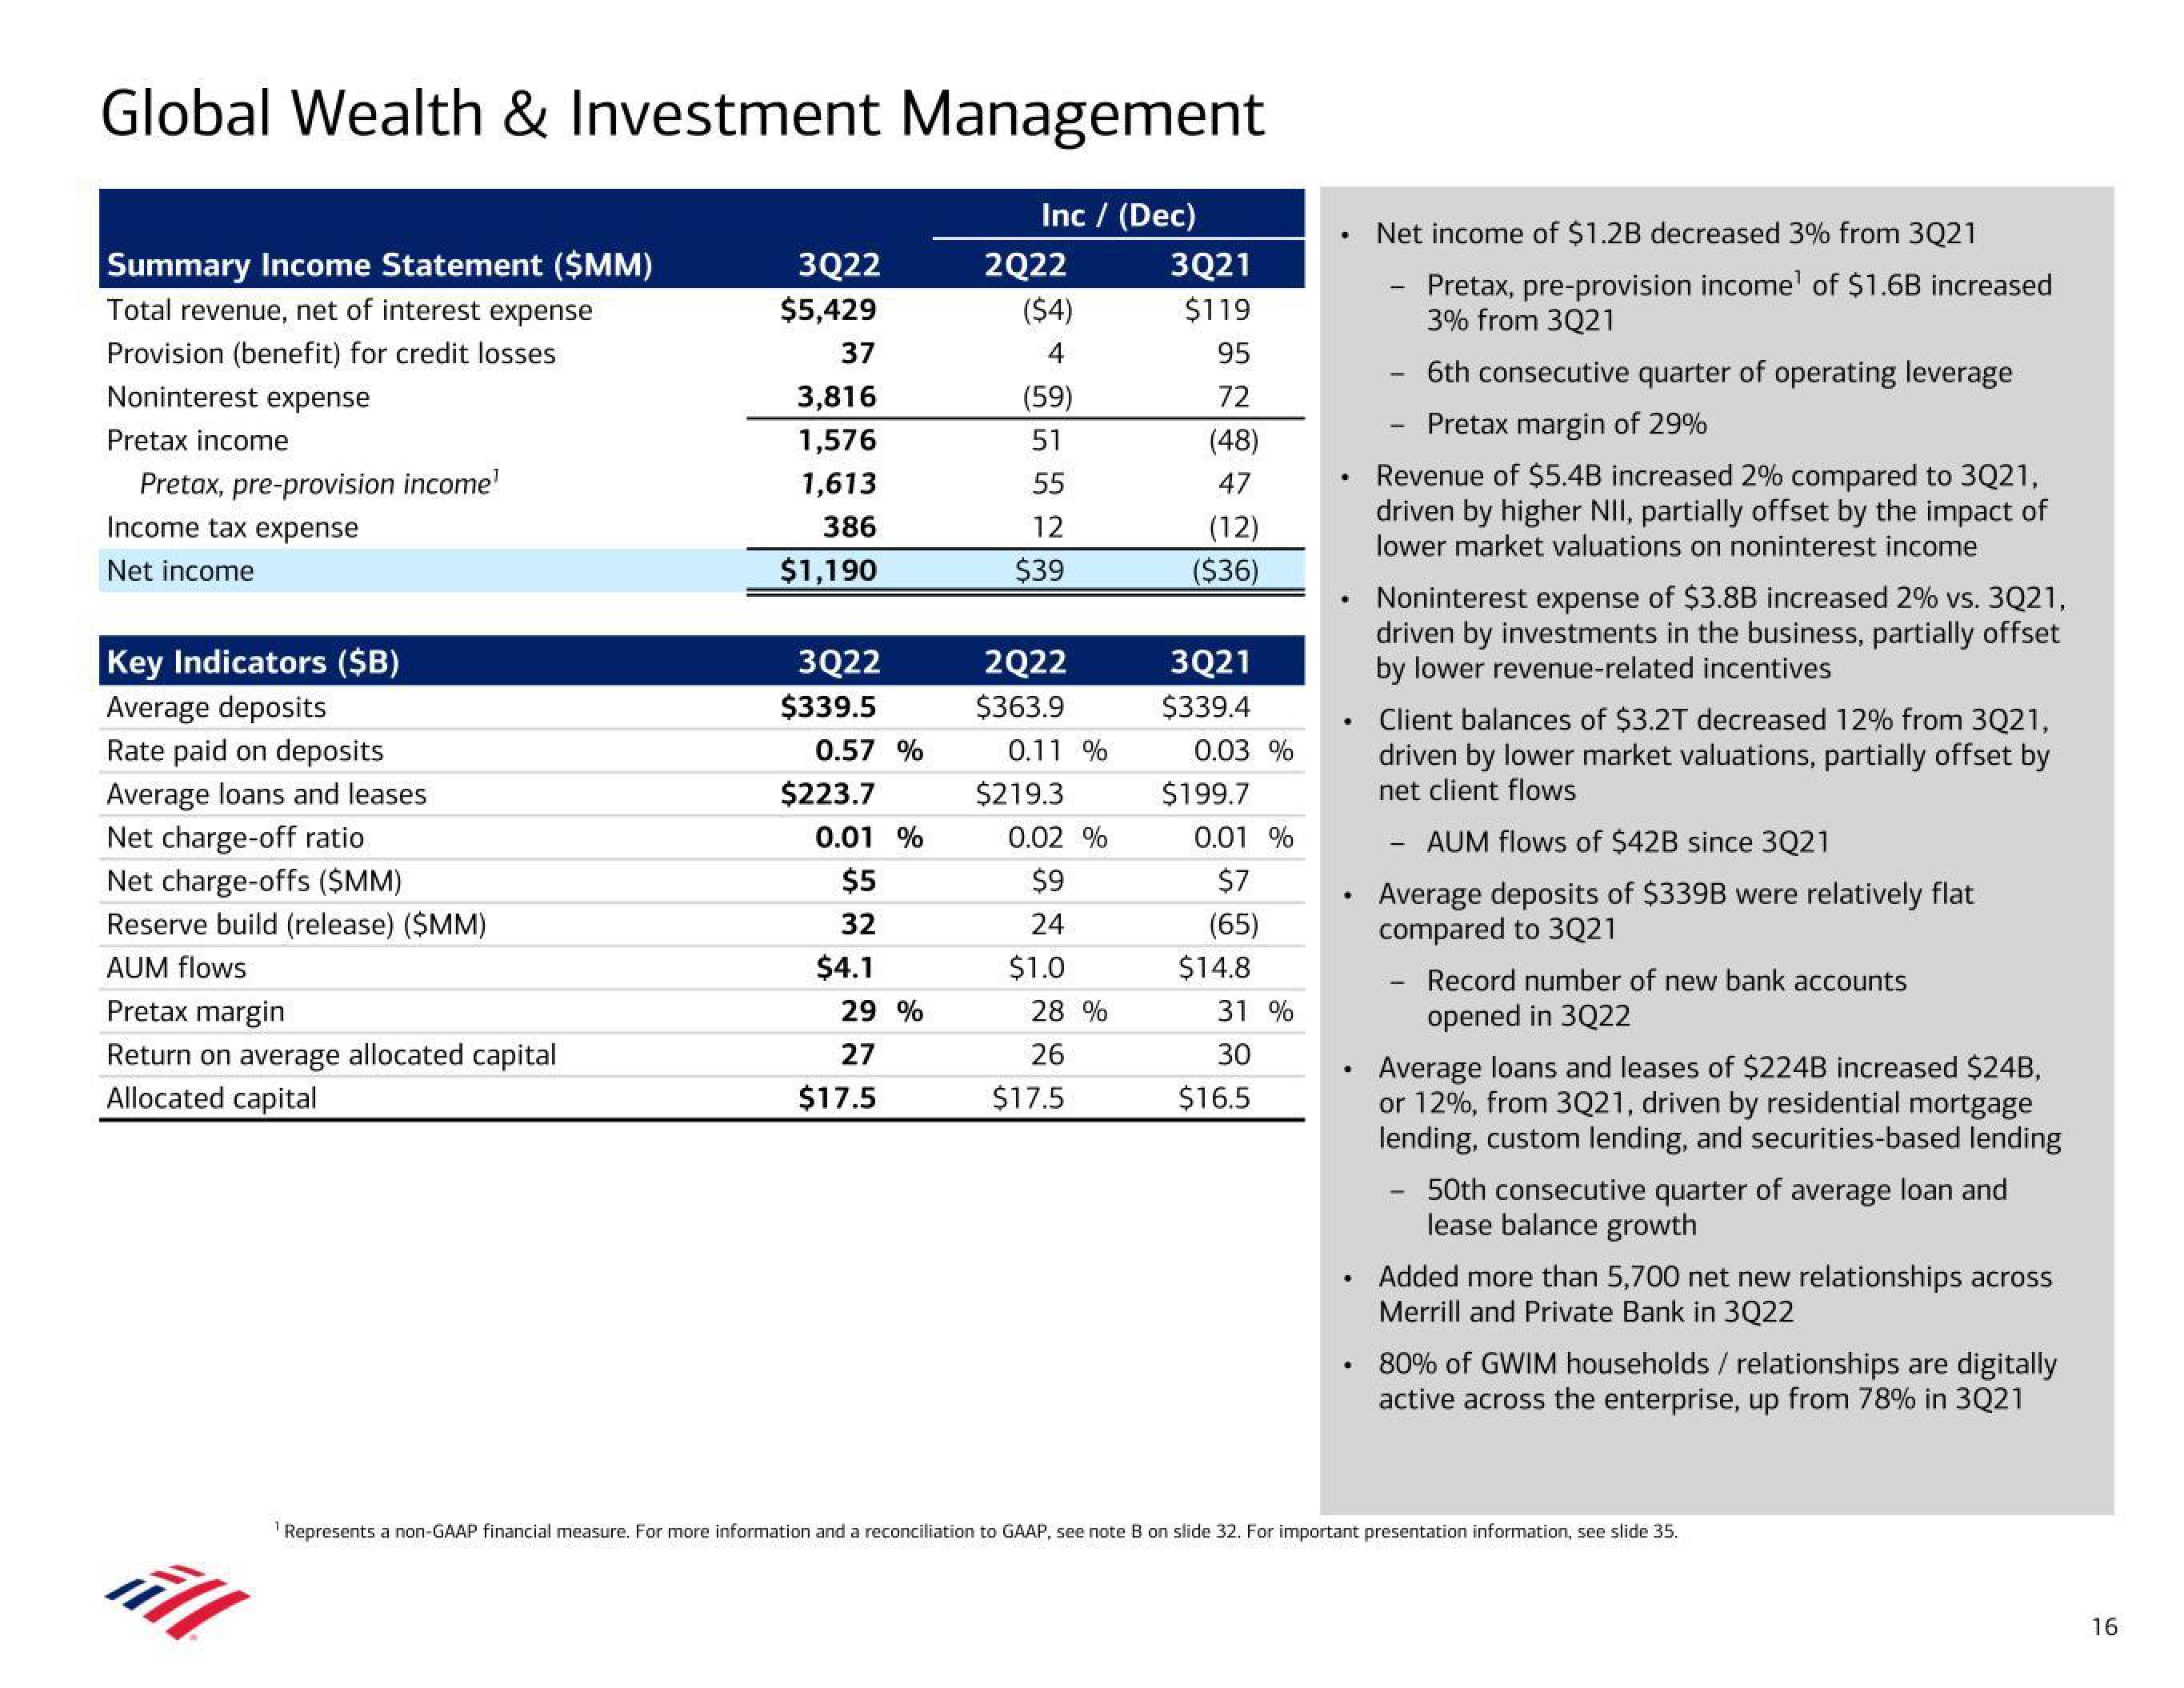
Net income of $1.2B decreased 3% from 3Q21
Pretax, pre-provision income of $1.6B increased
3% from 3Q21
6th consecutive quarter of operating leverage
Pretax margin of 29%
Revenue of $5.4B increased 2% compared to 3Q21,
driven by higher NII, partially offset by the impact of
lower market valuations on noninterest income
Noninterest expense of $3.8B increased 2% vs. 3Q21,
driven by investments in the business, partially offset
by lower revenue-related incentives
Client balances of $3.2T decreased 12% from 3Q21,
driven by lower market valuations, partially offset by
net client flows
AUM flows of $42B since 3Q21
Average deposits of $339B were relatively flat
compared to 3Q21
Record number of new bank accounts
opened in 3Q22
Average loans and leases of $224B increased $24B,
or 12%, from 3Q21, driven by residential mortgage
lending, custom lending, and securities-based lending
-
50th consecutive quarter of average loan and
lease balance growth
Added more than 5,700 net new relationships across
Merrill and Private Bank in 3Q22
80% of GWIM households / relationships are digitally
active across the enterprise, up from 78% in 3Q21
Represents a non-GAAP financial measure. For more information and a reconciliation to GAAP, see note B on slide 32. For important presentation information, see slide 35.
16View entire presentation