First-Quarter 2023 Earnings Presentation
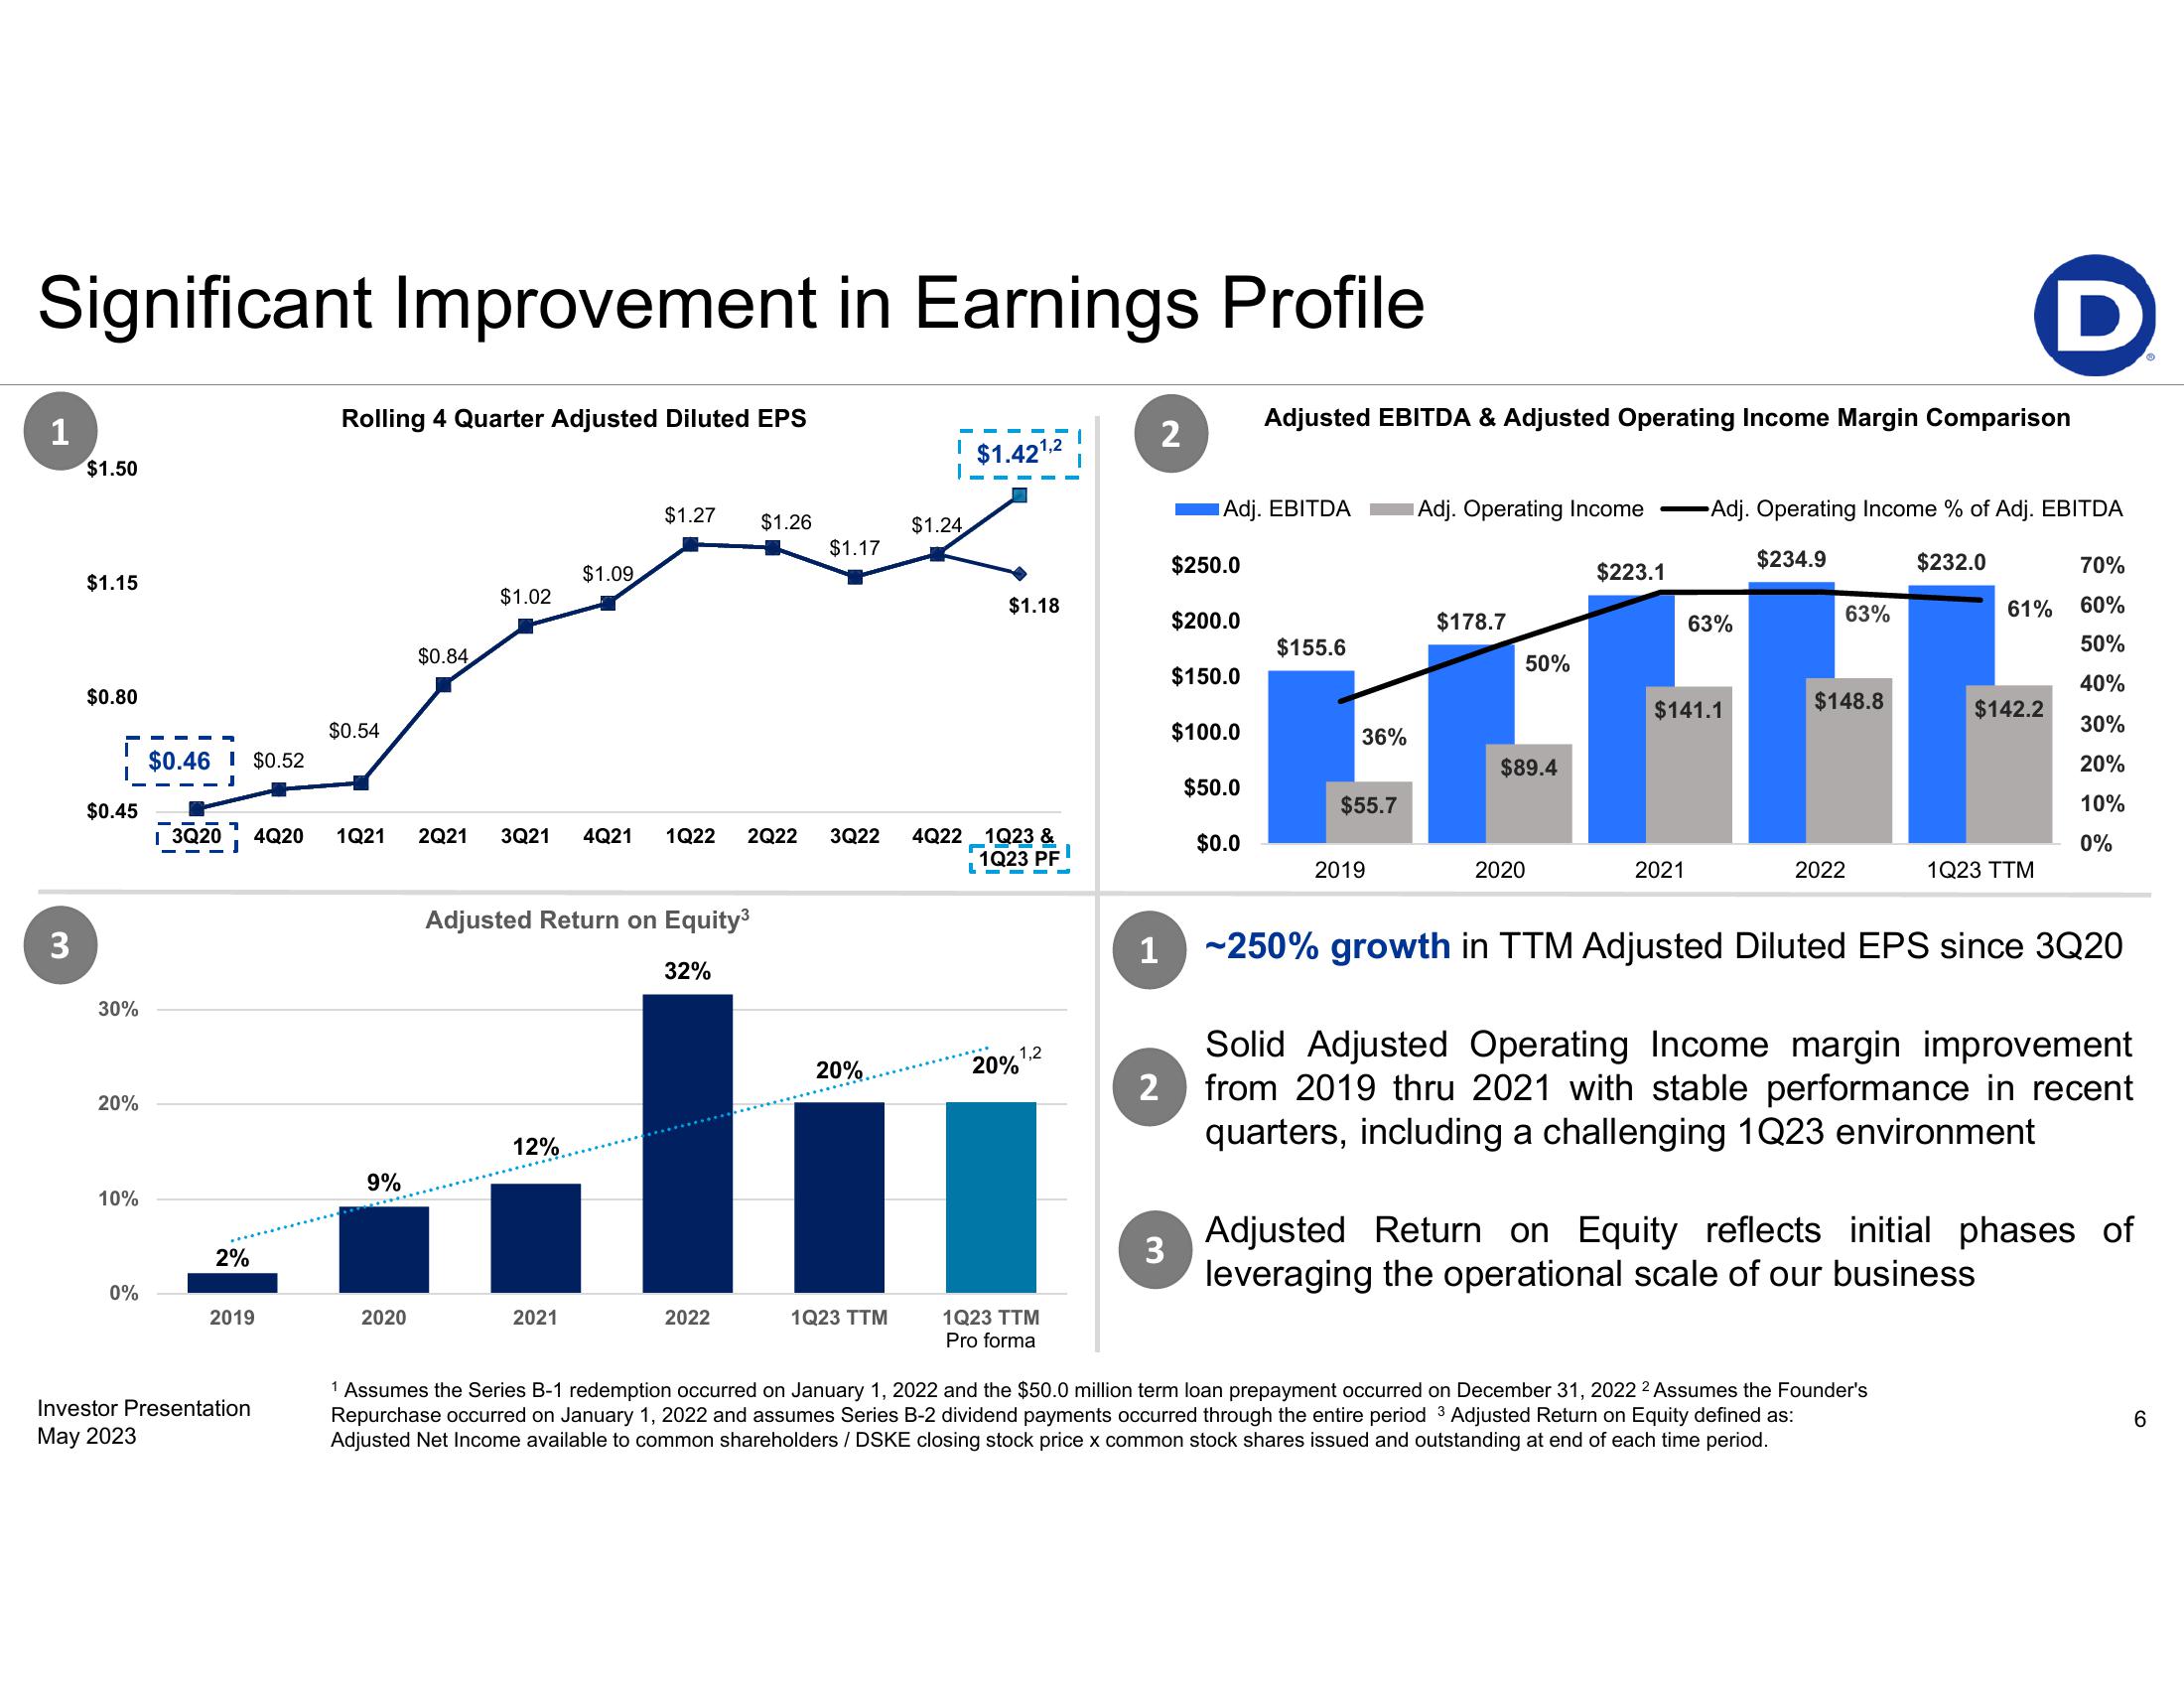
Significant Improvement in Earnings Profile
1
3
$1.50
$1.15
$0.80
ī
$0.45
30%
20%
10%
0%
$0.46 $0.52
2%
3Q20 4020 1Q21
2019
Rolling 4 Quarter Adjusted Diluted EPS
Investor Presentation
May 2023
$0.54
9%
2020
$0.84
$1.02
$1.09.
12%
$1.27
Adjusted Return on Equity³
32%
2021
2Q21 3Q21 4Q21 1Q22 2Q22 3Q22
$1.26
2022
$1.17
20%
1Q23 TTM
T
$1.24
$1.421,2
$1.18
4Q22 1Q23 &
1Q23 PF
LEE'-
1,2
20%
1Q23 TTM
Pro forma
2
1
3
Adj. EBITDA
$250.0
$200.0
$150.0
$100.0
$50.0
$0.0
Adjusted EBITDA & Adjusted Operating Income Margin Comparison
$155.6
36%
$55.7
2019
Adj. Operating Income Adj. Operating Income % of Adj. EBITDA
$234.9
$232.0
$178.7
50%
$89.4
2020
$223.1
63%
$141.1
2021
63%
$148.8
2022
D
70%
61% 60%
50%
40%
30%
20%
10%
0%
$142.2
1Q23 TTM
1 Assumes the Series B-1 redemption occurred on January 1, 2022 and the $50.0 million term loan prepayment occurred on December 31, 2022 2 Assumes the Founder's
Repurchase occurred on January 1, 2022 and assumes Series B-2 dividend payments occurred through the entire period 3 Adjusted Return on Equity defined as:
Adjusted Net Income available to common shareholders / DSKE closing stock price x common stock shares issued and outstanding at end of each time period.
~250% growth in TTM Adjusted Diluted EPS since 3Q20
Solid Adjusted Operating Income margin improvement
2 from 2019 thru 2021 with stable performance in recent
quarters, including a challenging 1Q23 environment
Adjusted Return on Equity reflects initial phases of
leveraging the operational scale of our business
6View entire presentation