MoneyLion Investor Conference Presentation Deck slide image

MoneyLion Investor Conference Presentation Deck

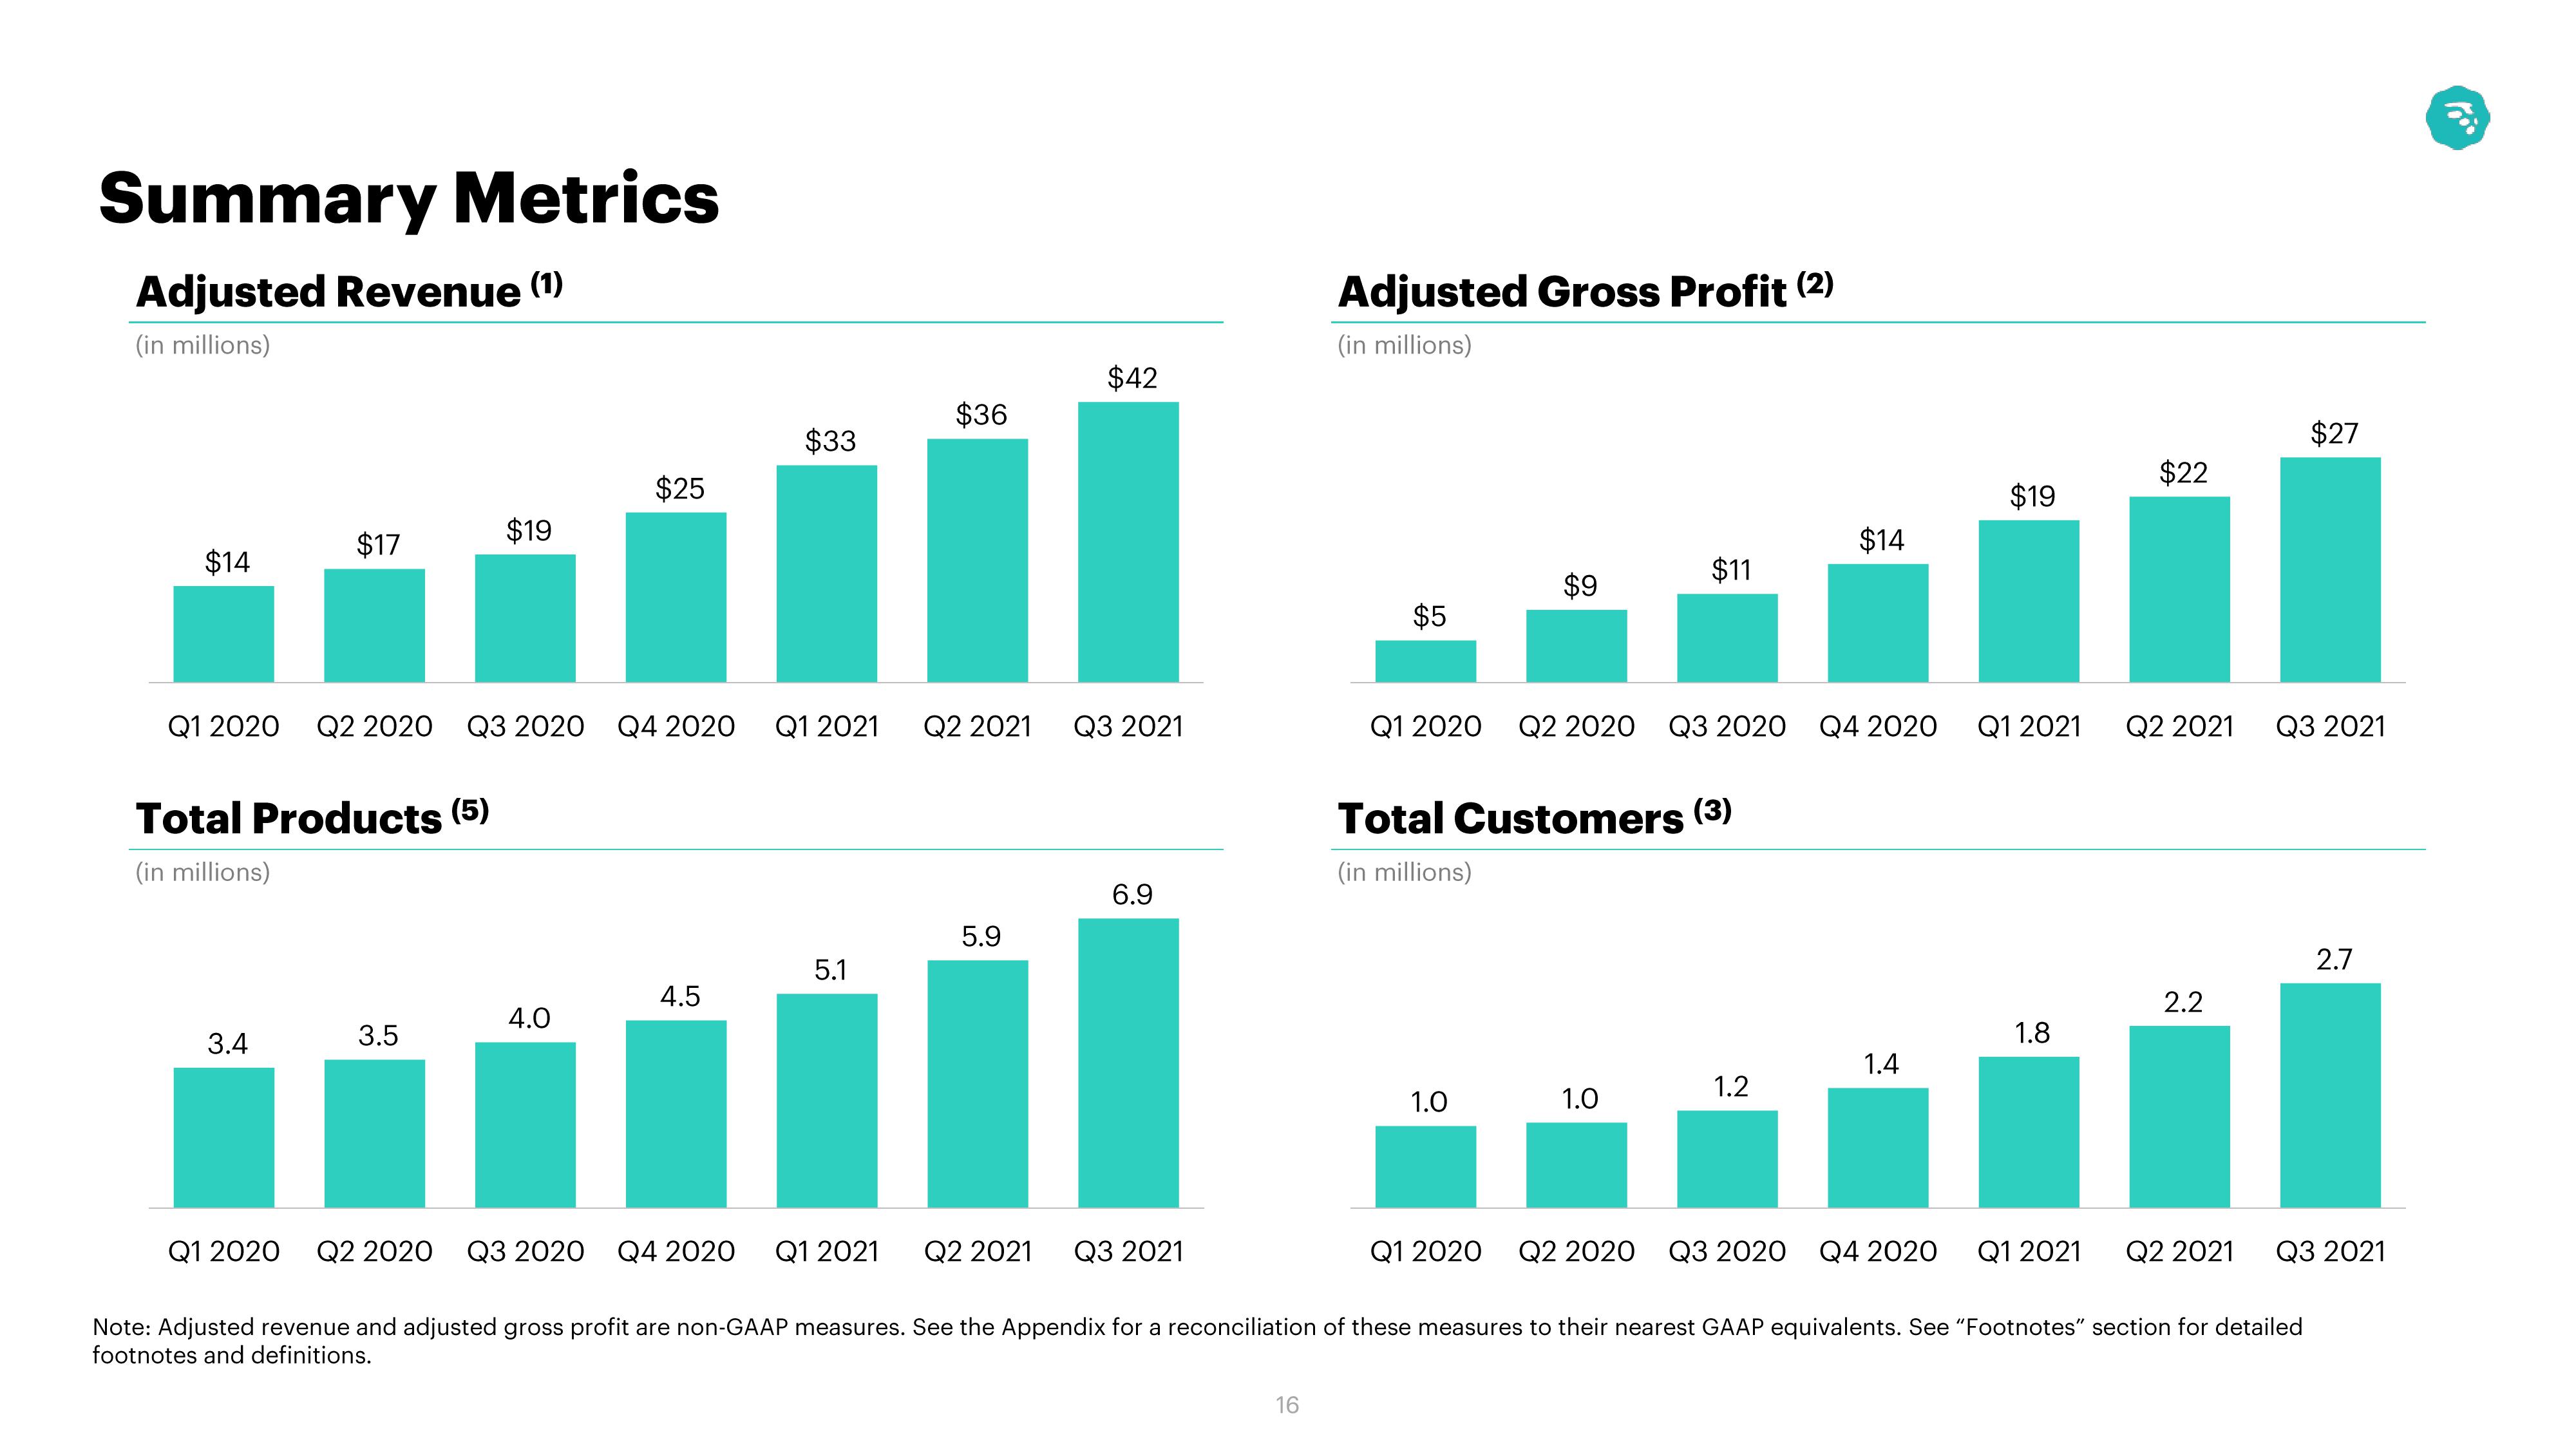
Summary Metrics Adjusted Revenue (1) (in millions) $14 $17 3.4 $19 3.5 Q1 2020 Q2 2020 Q3 2020 Q4 2020 Q1 2021 Total Products (5) (in millions) $25 4.0 $33 4.5 5.1 $36 $42 || Q2 2021 Q3 2021 5.9 6.9 Q1 2020 Q2 2020 Q3 2020 Q4 2020 Q1 2021 Q2 2021 Q3 2021 Adjusted Gross Profit (2) (in millions) 16 $5 $9 1.0 1.0 $11 Q1 2020 Q2 2020 Q1 2020 Q2 2020 Q3 2020 Q4 2020 Q1 2021 Q2 2021 Total Customers (3) (in millions) $14 1.2 $19 1.4 1.8 $22 Q3 2020 Q4 2020 Q1 2021 2.2 Q2 2021 $27 Q3 2021 Note: Adjusted revenue and adjusted gross profit are non-GAAP measures. See the Appendix for a reconciliation of these measures to their nearest GAAP equivalents. See "Footnotes" section for detailed footnotes and definitions. 2.7 Q3 2021
View entire presentation