Origo Results Presentation Deck
✔
Income Statement Q3 2021
Operating Profit Up from Last Year
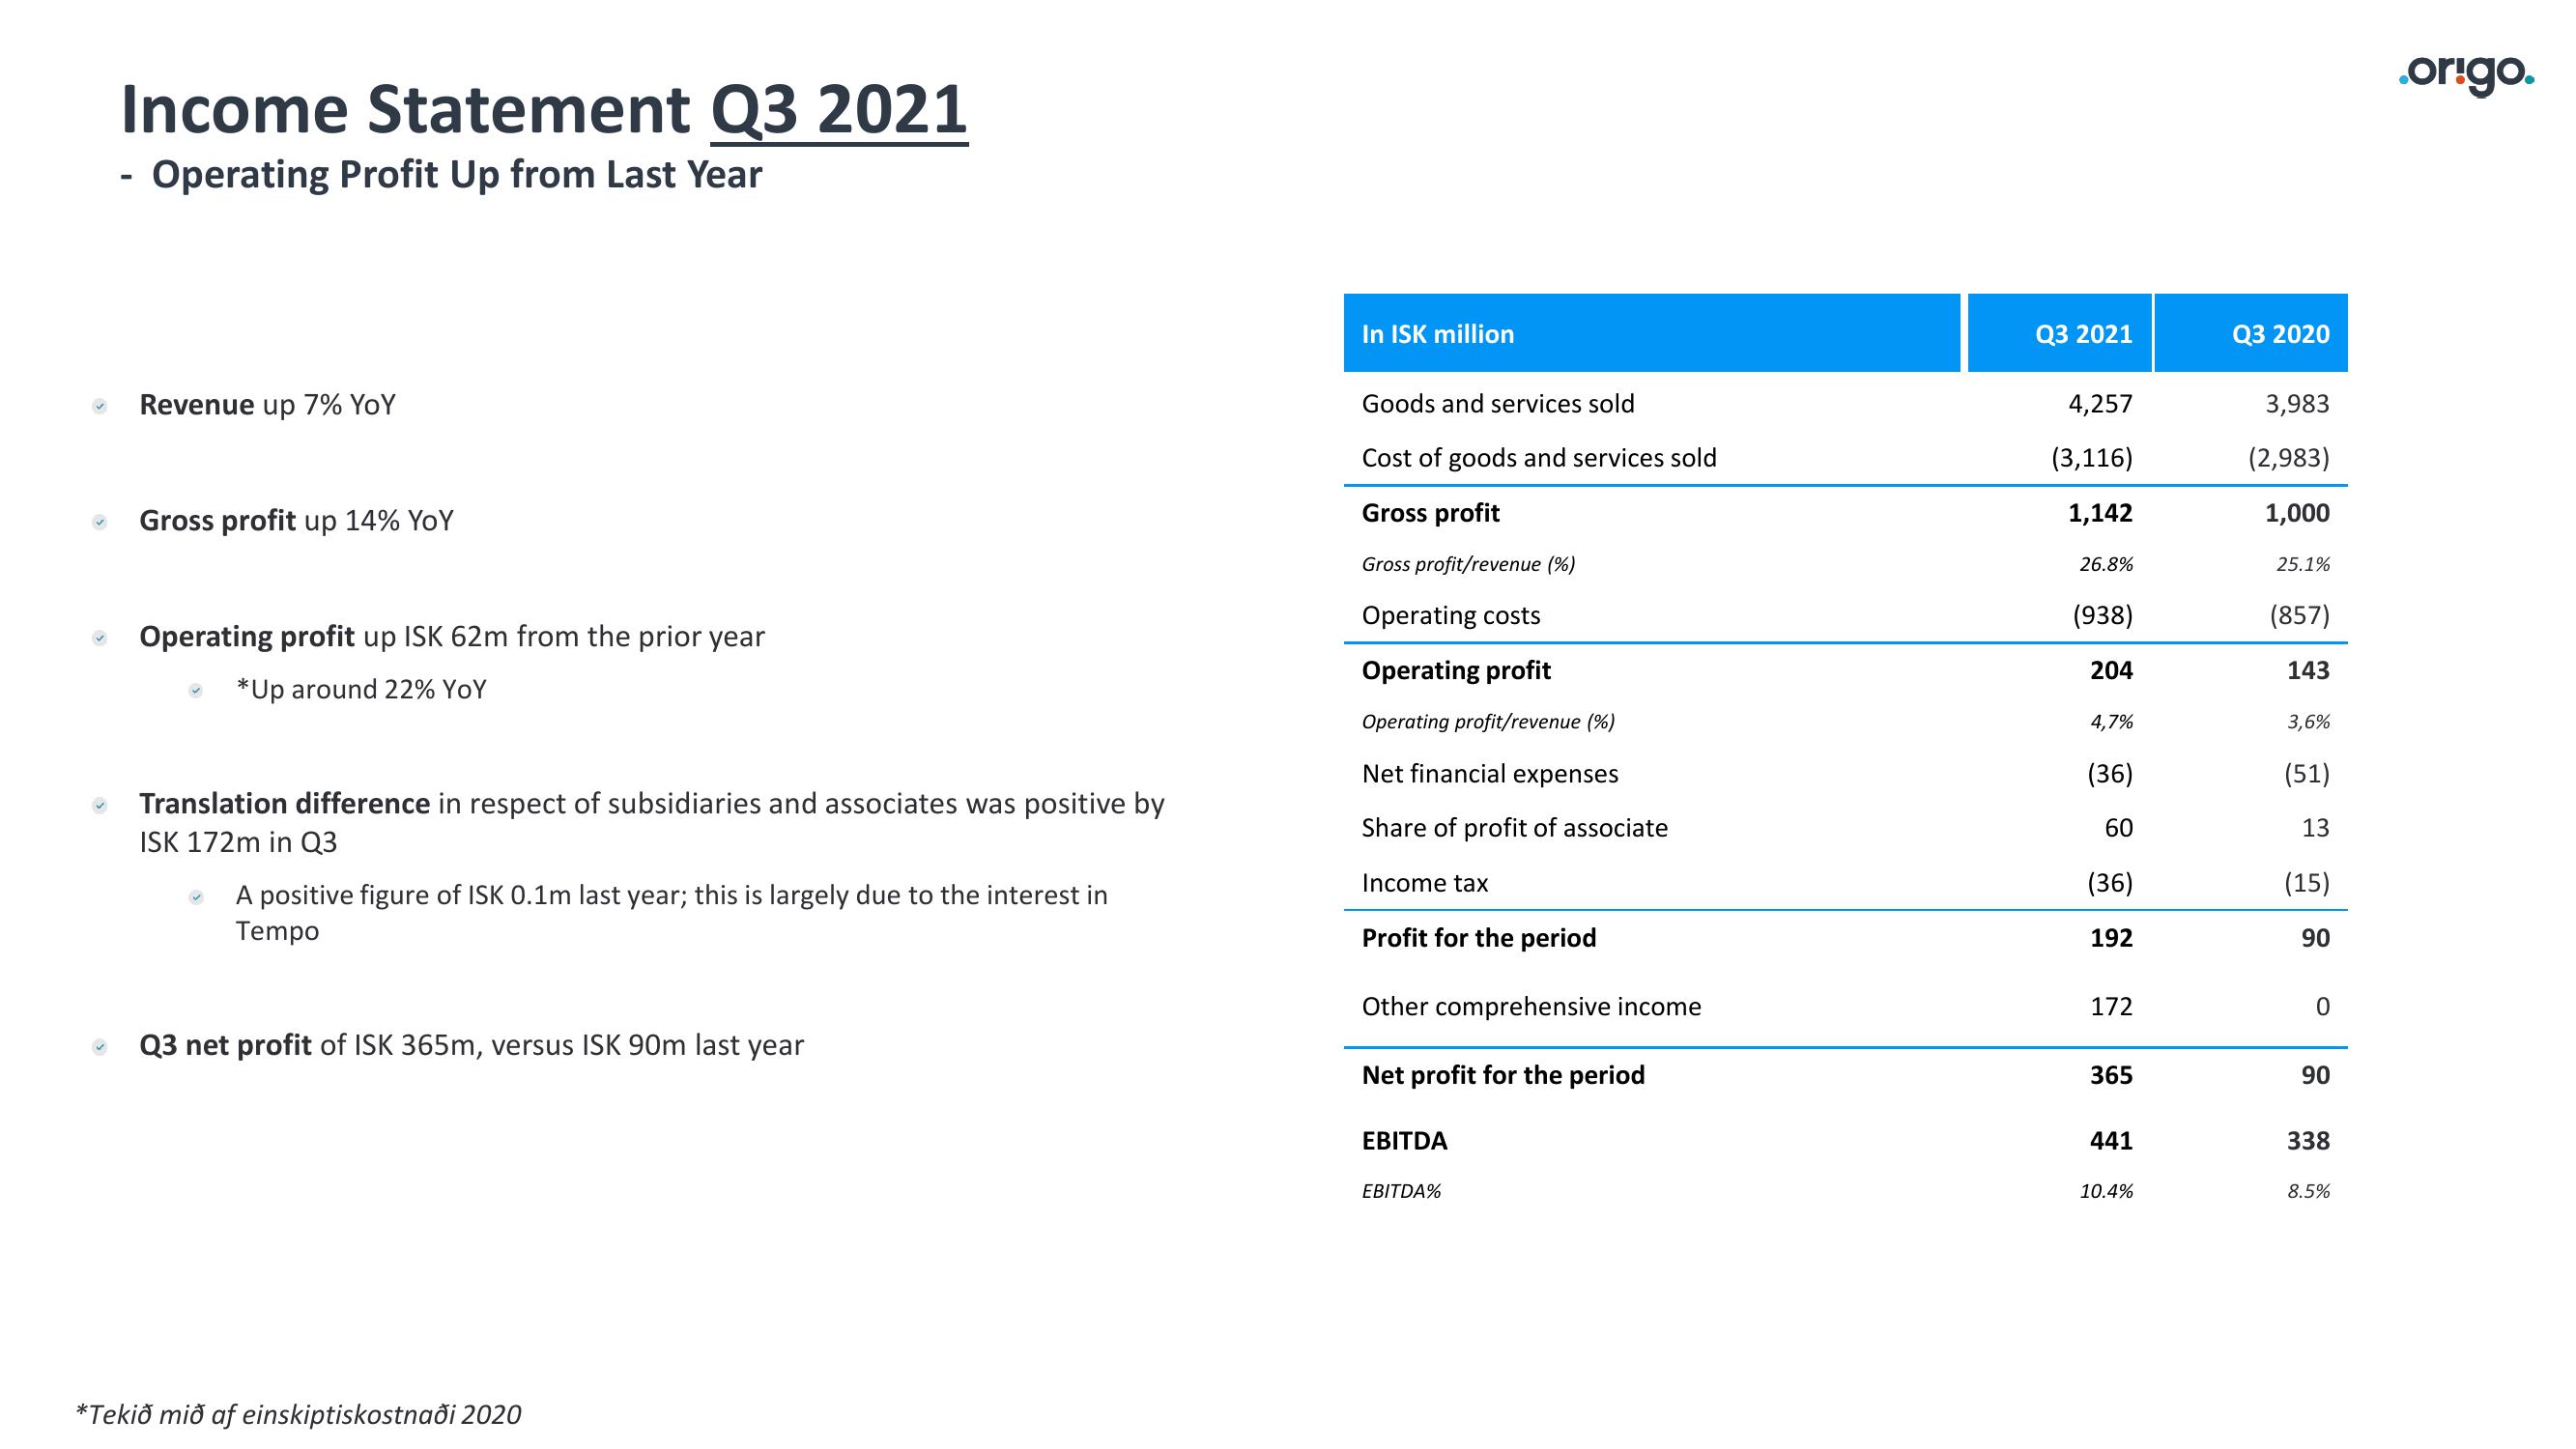
Revenue up 7% YoY
Gross profit up 14% YoY
Operating profit up ISK 62m from the prior year
*Up around 22% YoY
Translation difference in respect of subsidiaries and associates was positive by
ISK 172m in Q3
A positive figure of ISK 0.1m last year; this is largely due to the interest in
Tempo
Q3 net profit of ISK 365m, versus ISK 90m last year
*Tekið mið af einskiptiskostnaði 2020
In ISK million
Goods and services sold
Cost of goods and services sold
Gross profit
Gross profit/revenue (%)
Operating costs
Operating profit
Operating profit/revenue (%)
Net financial expenses
Share of profit of associate
Income tax
Profit for the period
Other comprehensive income
Net profit for the period
EBITDA
EBITDA%
Q3 2021
4,257
(3,116)
1,142
26.8%
(938)
204
4,7%
(36)
60
(36)
192
172
365
441
10.4%
Q3 2020
3,983
(2,983)
1,000
25.1%
(857)
143
3,6%
(51)
13
(15)
90
0
90
338
8.5%
.origo.View entire presentation