DiDi IPO Presentation Deck
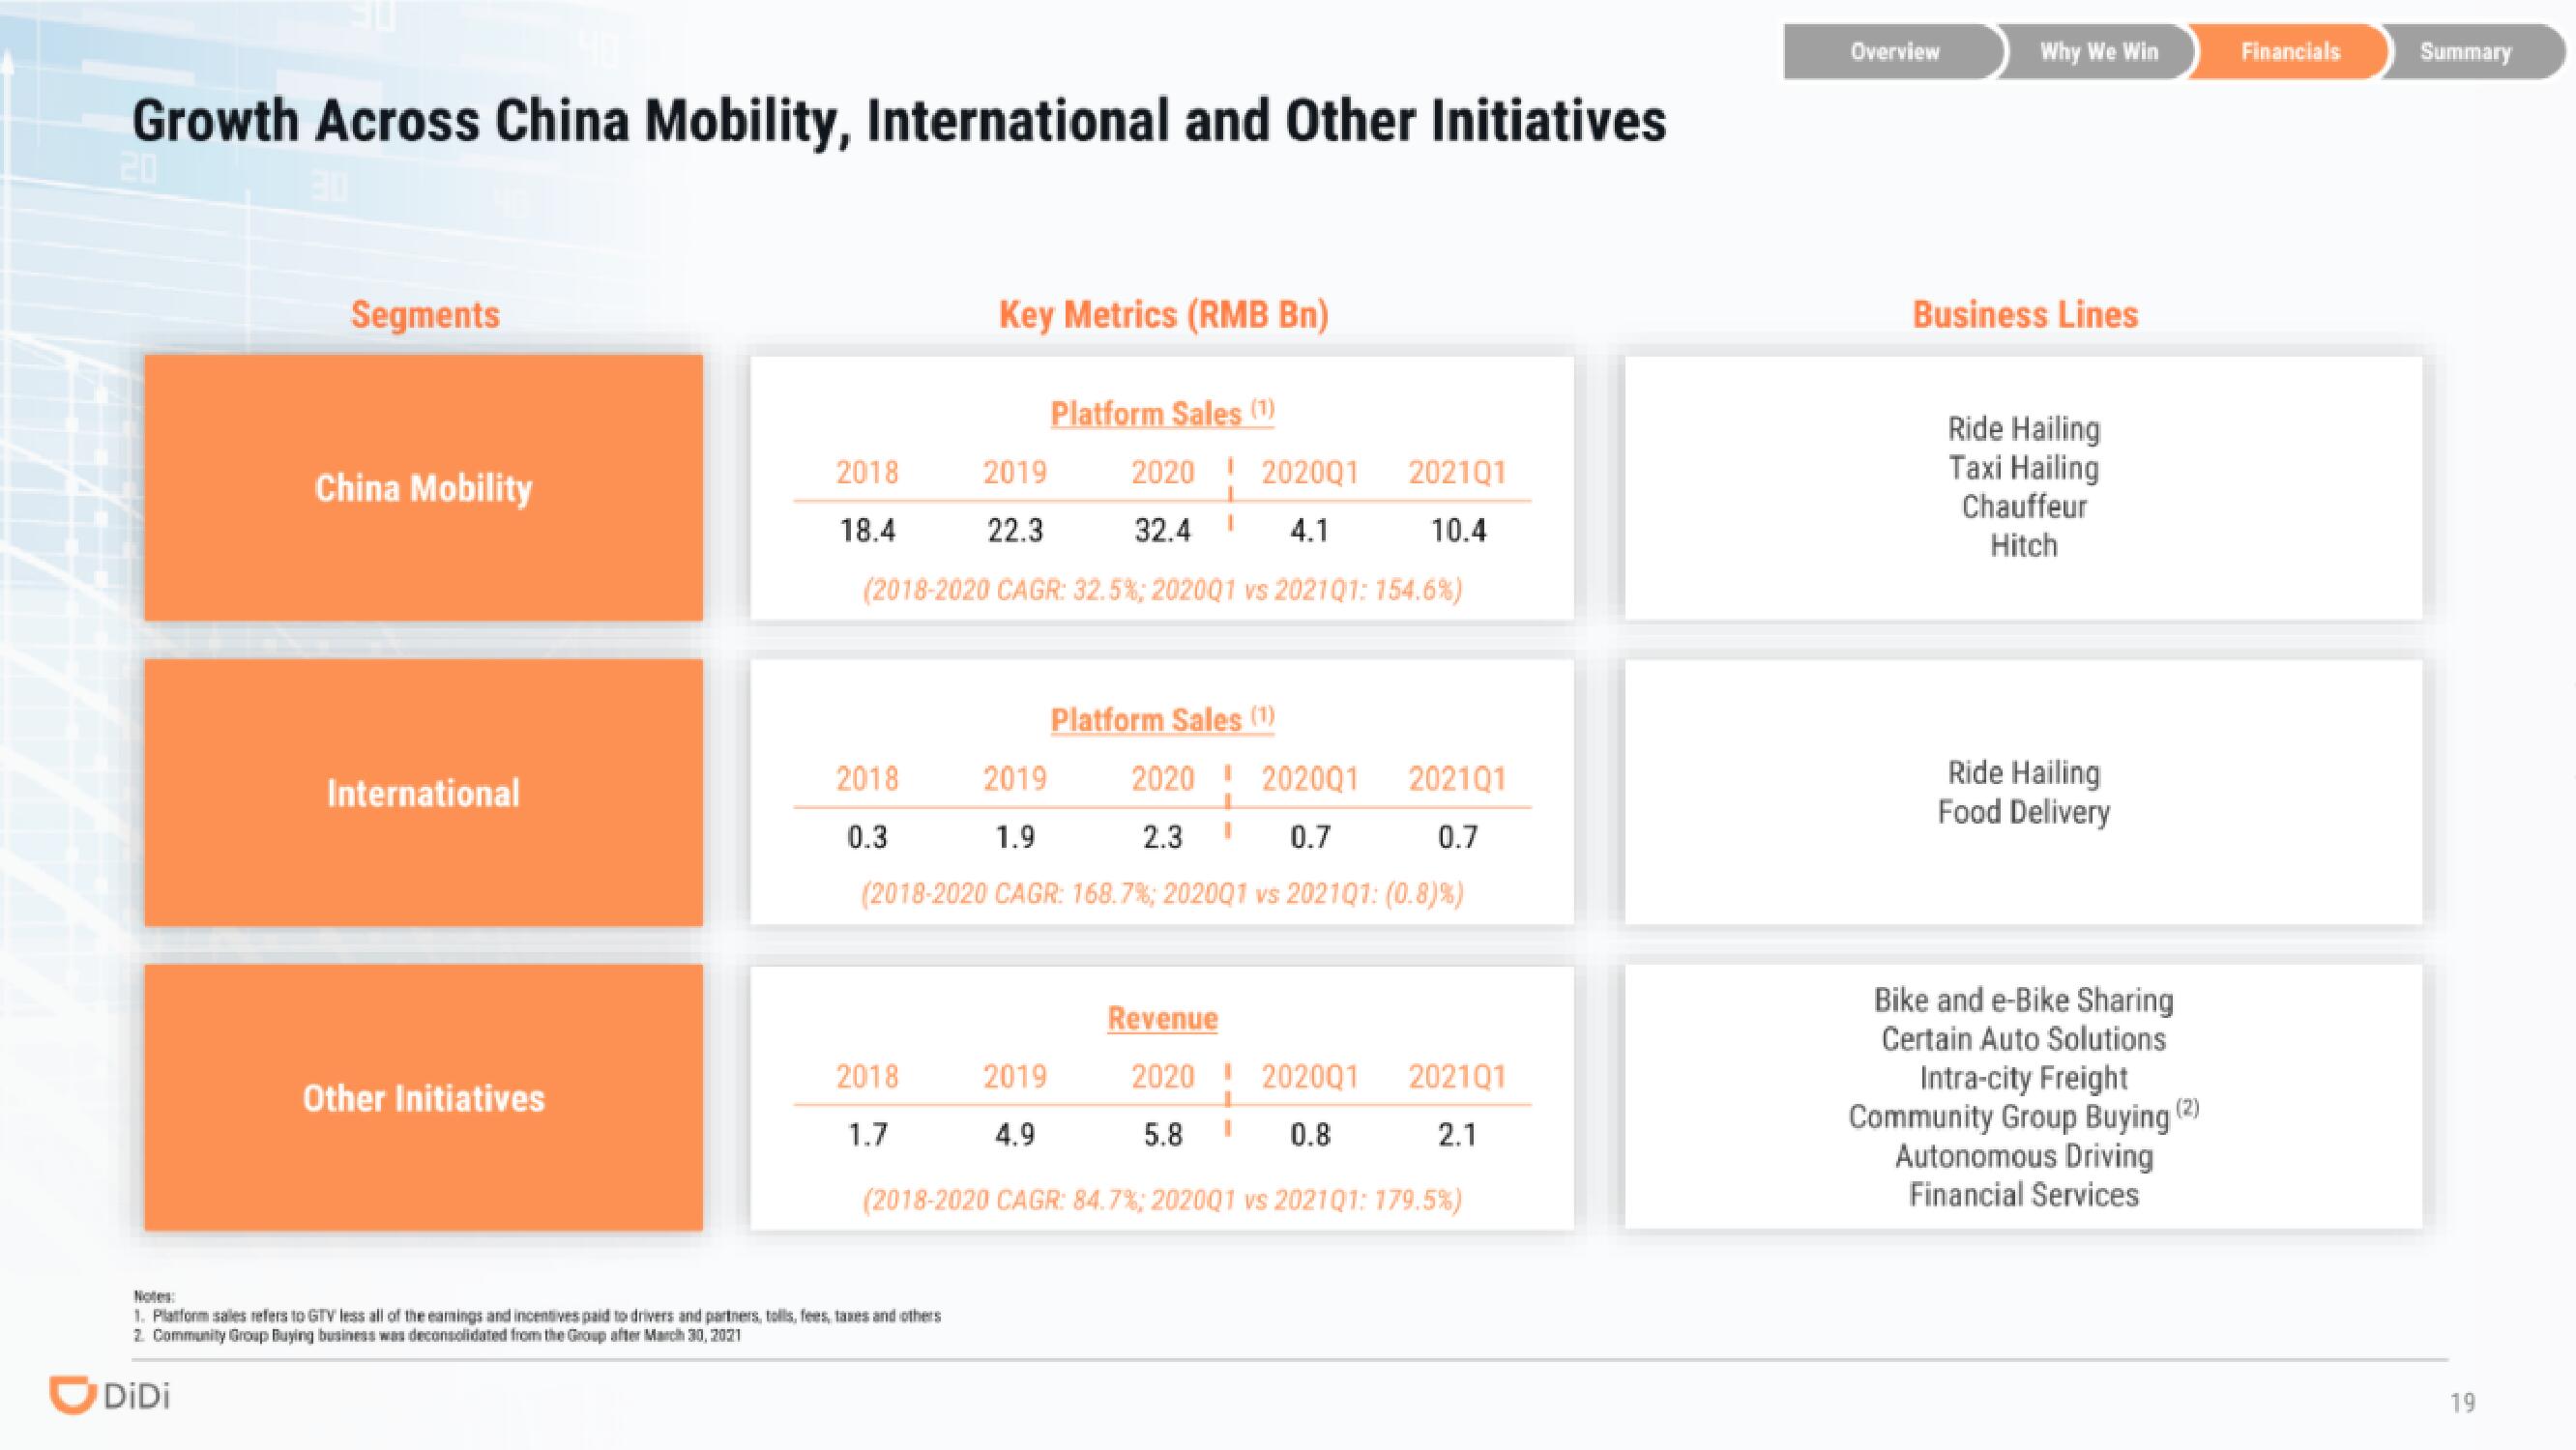
Growth Across China Mobility, International and Other Initiatives
30
Segments
China Mobility
International
Other Initiatives
2018
18.4
2019
2020 202001
32.4
4.1
22.3
(2018-2020 CAGR: 32.5%; 202001 vs 202101: 154.6%)
2018
0.3
Key Metrics (RMB Bn)
Platform Sales (1)
202101
I
2019 2020 202001
1.9
2.3 I
0.7
(2018-2020 CAGR: 168.7%; 202001 vs 202101: (0.8) %)
0.7
2018
1.7
Platform Sales (1)
Notes:
1. Platform sales refers to GTV less all of the eamings and incentives paid to drivers and partners, tolls, fees, taxes and others
2. Community Group Buying business was deconsolidated from the Group after March 30, 2021
DiDi
Revenue
2020 202001 202101
0.8
L
5.8 I
2.1
(2018-2020 CAGR: 84.7%; 202001 vs 202101: 179.5%)
202101
10.4
2019
4.9
Overview
Why We Win
Business Lines
Ride Hailing
Taxi Hailing
Chauffeur
Hitch
Ride Hailing
Food Delivery
Bike and e-Bike Sharing
Certain Auto Solutions
Intra-city Freight
Community Group Buying (2)
Autonomous Driving
Financial Services
Financials
Summary
19View entire presentation