Maersk Results Presentation Deck
Maersk Group
- Interim Report 03 2015
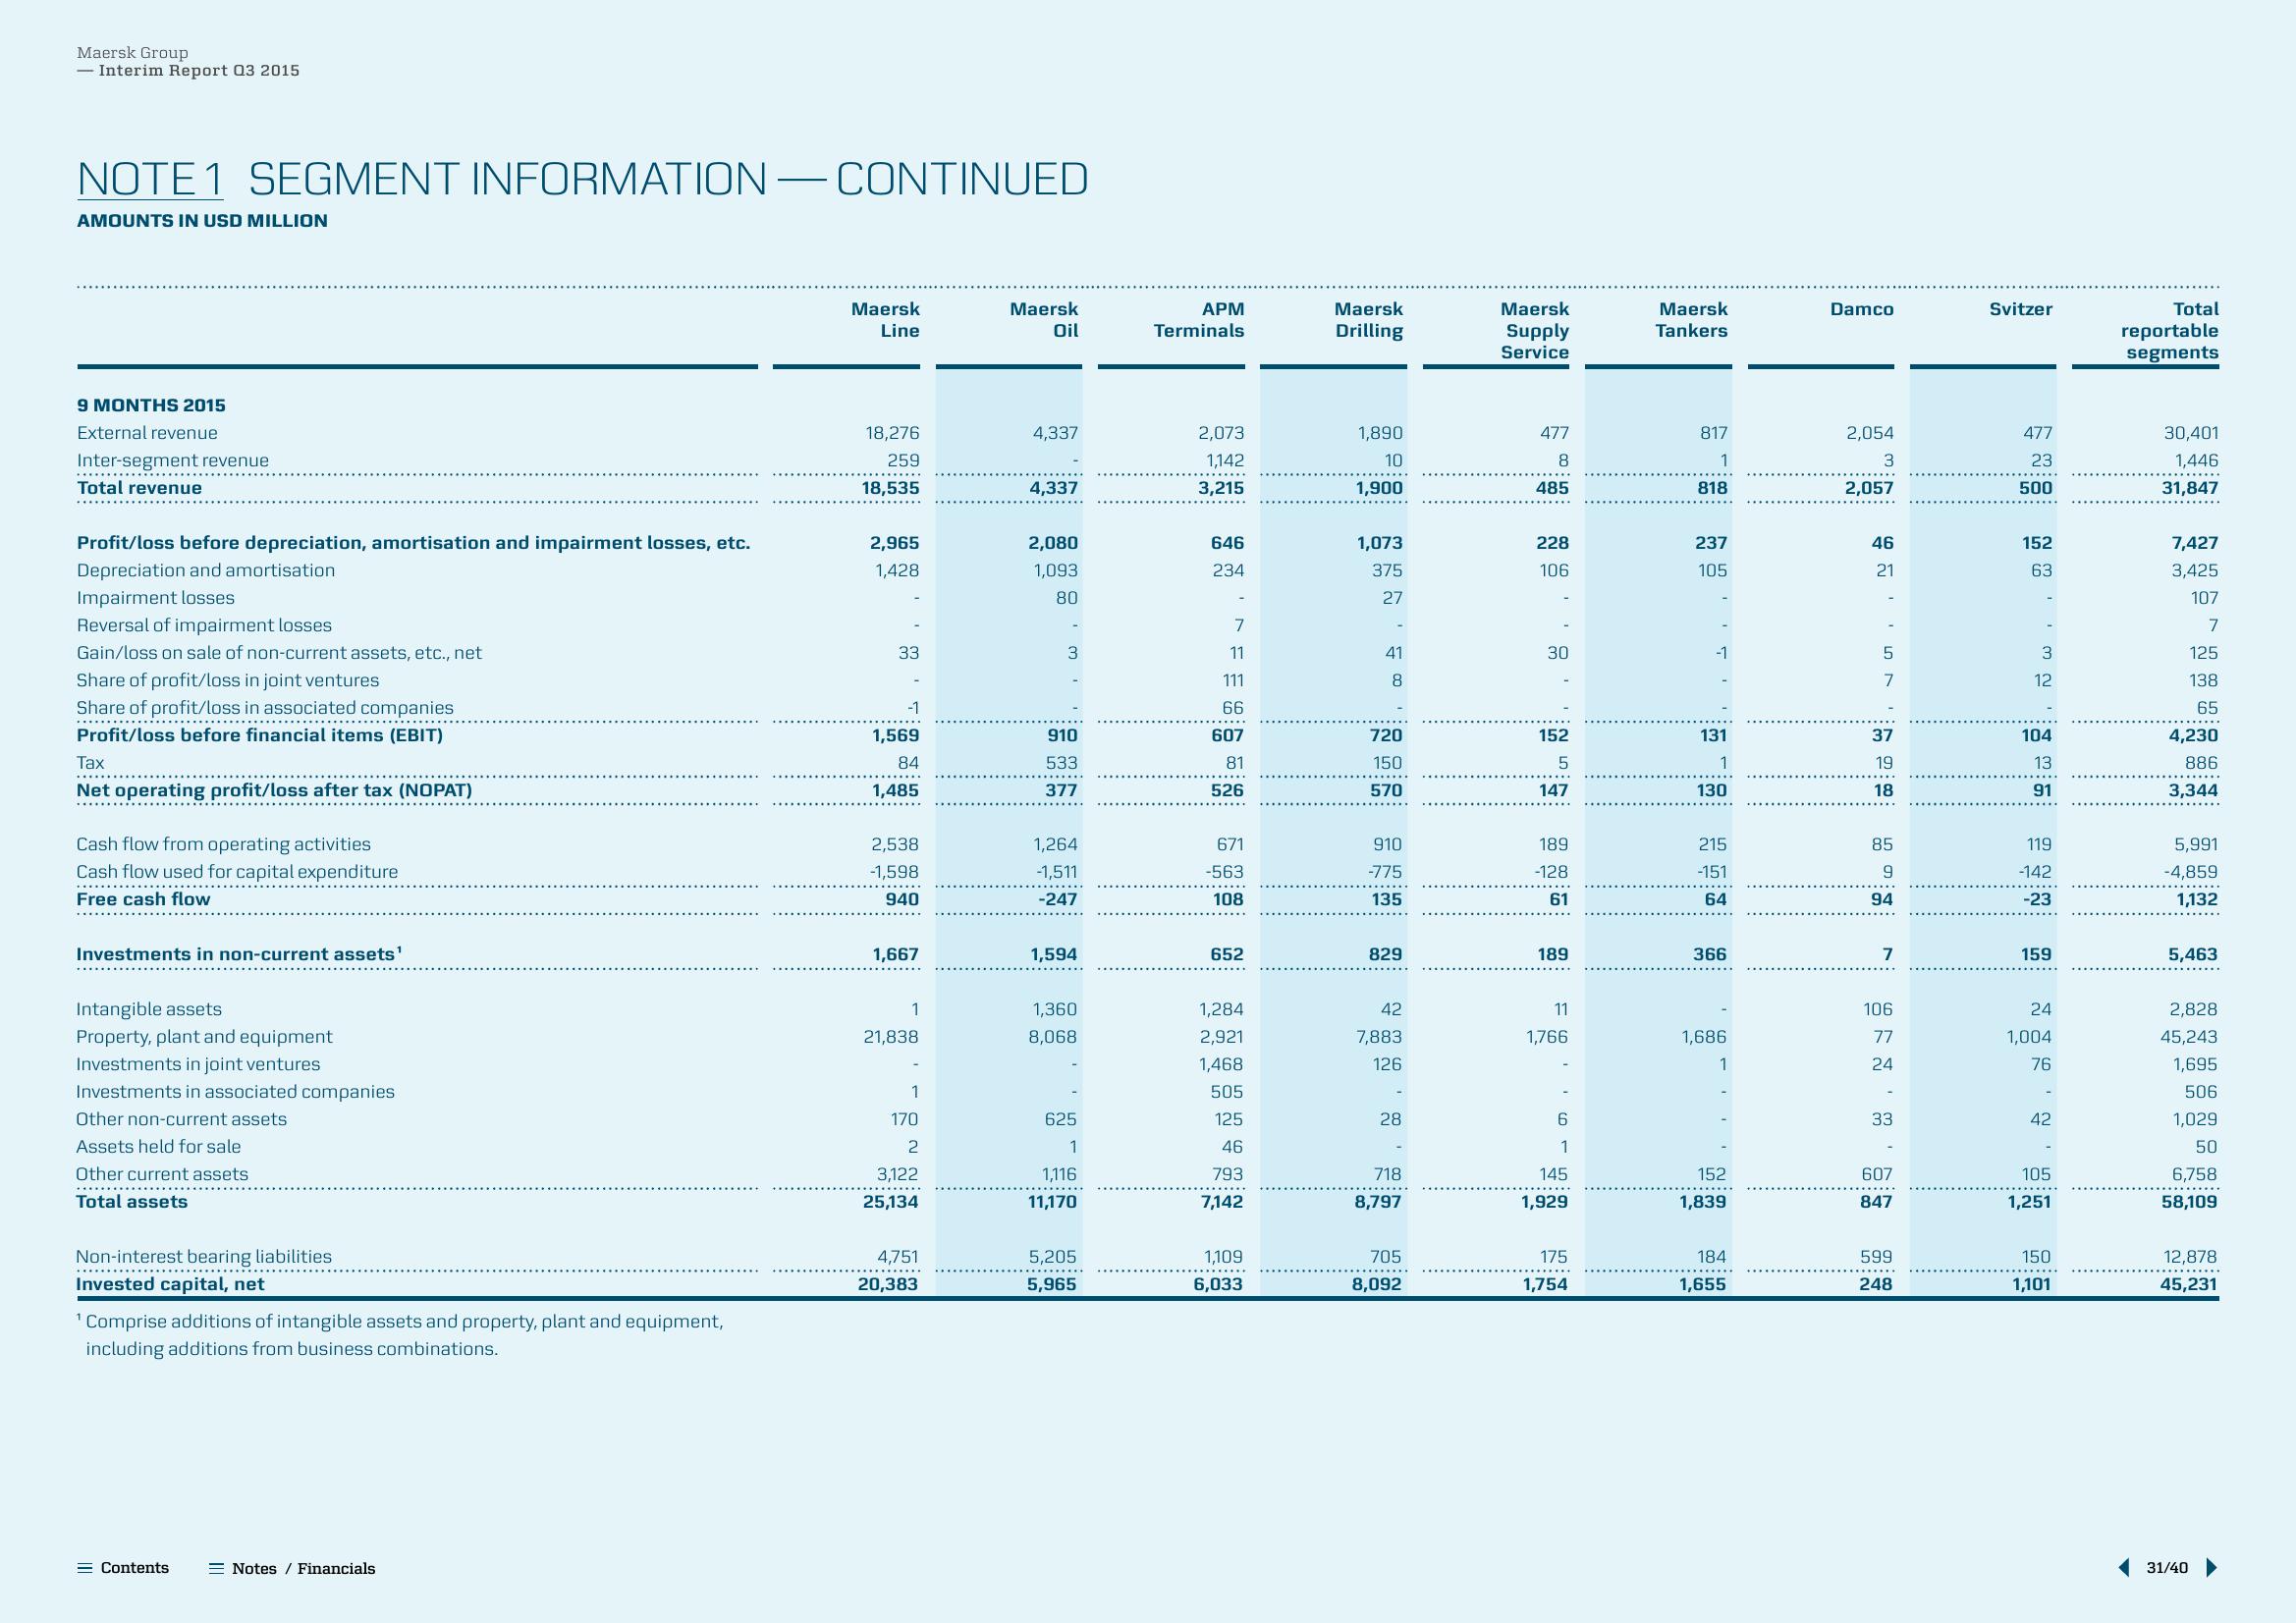
NOTE 1 SEGMENT INFORMATION — CONTINUED
AMOUNTS IN USD MILLION
9 MONTHS 2015
External revenue
Inter-segment revenue
Total revenue
Profit/loss before depreciation, amortisation and impairment losses, etc.
Depreciation and amortisation
Impairment losses
Reversal of impairment losses
Gain/loss on sale of non-current assets, etc., net
Share of profit/loss in joint ventures
Share of profit/loss in associated companies
Profit/loss before financial items (EBIT)
**********
Tax
Net operating profit/loss after tax (NOPAT)
Cash flow from operating activities
Cash flow used for capital expenditure
Free cash flow
Investments in non-current assets¹
Intangible assets
Property, plant and equipment
Investments in joint ventures
Investments in associated companies
Other non-current assets
Assets held for sale
Other current assets
*********.
Total assets
Non-interest bearing liabilities
Invested capital, net
¹ Comprise additions of intangible assets and property, plant and equipment,
including additions from business combinations.
= Contents
Notes / Financials
Maersk
Line
18,276
259
18,535
2,965
1,428
33
-1
1,569
84
1,485
2,538
-1,598
940
1,667
1
21,838
1
170
2
3,122
25,134
4,751
20,383
Maersk
Oil
4,337
4,337
2,080
1,093
80
3
910
533
377
1,264
-1,511
-247
1,594
1,360
8,068
625
1
1,116
11,170
5,205
5,965
APM
Terminals
2,073
1,142
3,215
646
234
7
11
111
66
607
81
526
671
-563
108
652
1,284
2,921
1,468
505
125
46
793
7,142
1,109
6,033
Maersk
Drilling
1,890
10
1,900
1,073
375
27
-
41
8
720
150
570
910
-775
135
829
42
7,883
126
28
718
8,797
705
8,092
Maersk
Supply
Service
477
8
485
228
106
30
152
5
147
189
-128
61
189
11
1,766
6
1
145
1,929
175
1,754
Maersk
Tankers
817
1
818
237
105
-1
131
1
130
215
-151
64
366
1,686
1
152
1,839
184
1,655
Damco
2,054
3
2,057
46
21
5
7
37
19
18
85
9
94
7
106
77
24
33
607
847
599
248
Svitzer
477
23
500
152
~ w.,
104
13
91
119
-142
-23
159
24
1,004
76
42
105
1,251
150
1,101
Total
reportable
segments
30,401
1,446
31,847
7,427
3,425
107
7
125
138
65
4,230
886
3,344
5,991
-4,859
1,132
5,463
2,828
45,243
1,695
506
1,029
50
6,758
58,109
12,878
45,231
31/40View entire presentation