TPG Results Presentation Deck
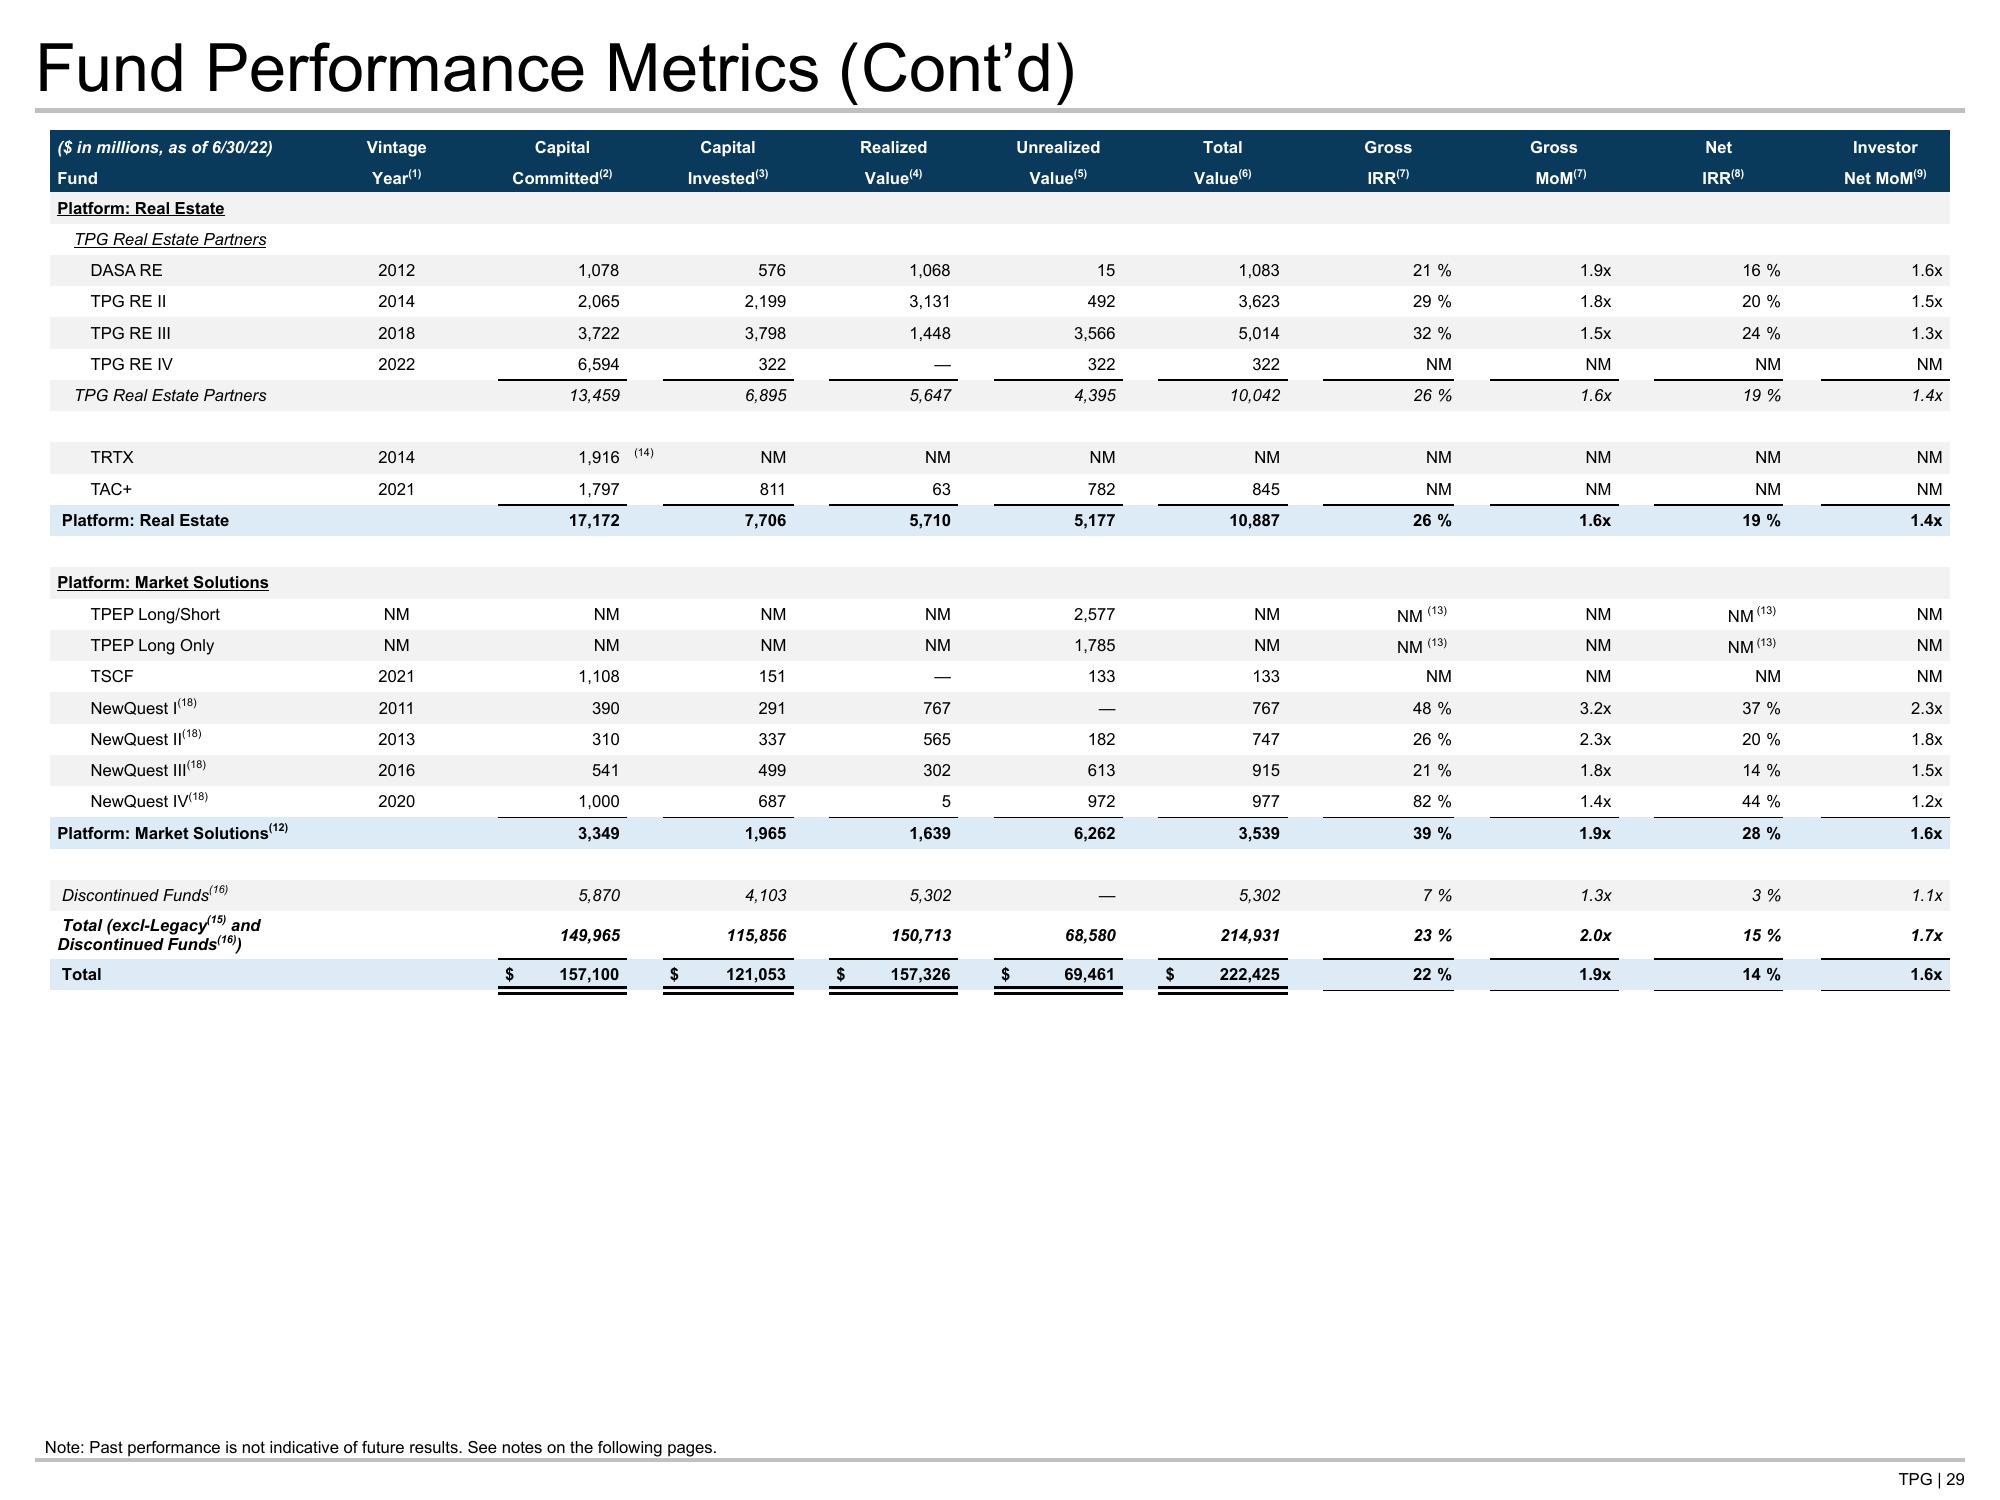
Fund Performance Metrics (Cont'd)
($ in millions, as of 6/30/22)
Fund
Vintage
Year(¹)
Capital
Invested (3)
Platform: Real Estate
TPG Real Estate Partners
DASA RE
TPG RE II
TPG RE III
TPG RE IV
TPG Real Estate Partners
TRTX
TAC+
Platform: Real Estate
Platform: Market Solutions
TPEP Long/Short
TPEP Long Only
TSCF
NewQuest (18)
NewQuest II(18)
NewQuest III(18)
NewQuest IV(18)
Platform: Market Solutions (12)
Discontinued Funds(16)
Total (excl-Legacy(15) and
Discontinued Funds (16))
Total
2012
2014
2018
2022
2014
2021
NM
NM
2021
2011
2013
2016
2020
Capital
Committed (2)
$
1,078
2,065
3,722
6,594
13,459
1,916 (14)
1,797
17,172
NM
NM
1,108
390
310
541
1,000
3,349
5,870
149,965
157,100
576
2,199
3,798
322
6,895
Note: Past performance is not indicative of future results. See notes on the following pages.
NM
811
7,706
NM
NM
151
291
337
499
687
1,965
4,103
115,856
$ 121,053
$
Realized
Value(4)
1,068
3,131
1,448
5,647
NM
63
5,710
NM
NM
767
565
302
5
1,639
5,302
150,713
157,326
$
Unrealized
Value(5)
15
492
3,566
322
4,395
NM
782
5,177
2,577
1,785
133
182
613
972
6,262
68,580
69,461
$
Total
Value (6)
1,083
3,623
5,014
322
10,042
NM
845
10,887
NM
NM
133
767
747
915
977
3,539
5,302
214,931
222,425
Gross
IRR(7)
21 %
29 %
32 %
NM
26 %
NM
NM
26%
NM (13)
NM (13)
NM
48%
26%
21%
82%
39%
7%
23 %
22 %
Gross
MOM(7)
1.9x
1.8x
1.5x
NM
1.6x
NM
NM
1.6x
NM
NM
NM
3.2x
2.3x
1.8x
1.4x
1.9x
1.3x
2.0x
1.9x
Net
IRR (8)
16 %
20 %
24 %
NM
19 %
NM
NM
19 %
NM (13)
NM (13)
NM
37 %
20%
14%
44 %
28%
3%
15%
14%
Investor
Net MoM (⁹)
1.6x
1.5x
1.3x
NM
1.4x
NM
NM
1.4x
NM
NM
NM
2.3x
1.8x
1.5x
1.2x
1.6x
1.1x
1.7x
1.6x
TPG | 29View entire presentation