Vivid Seats SPAC Presentation Deck
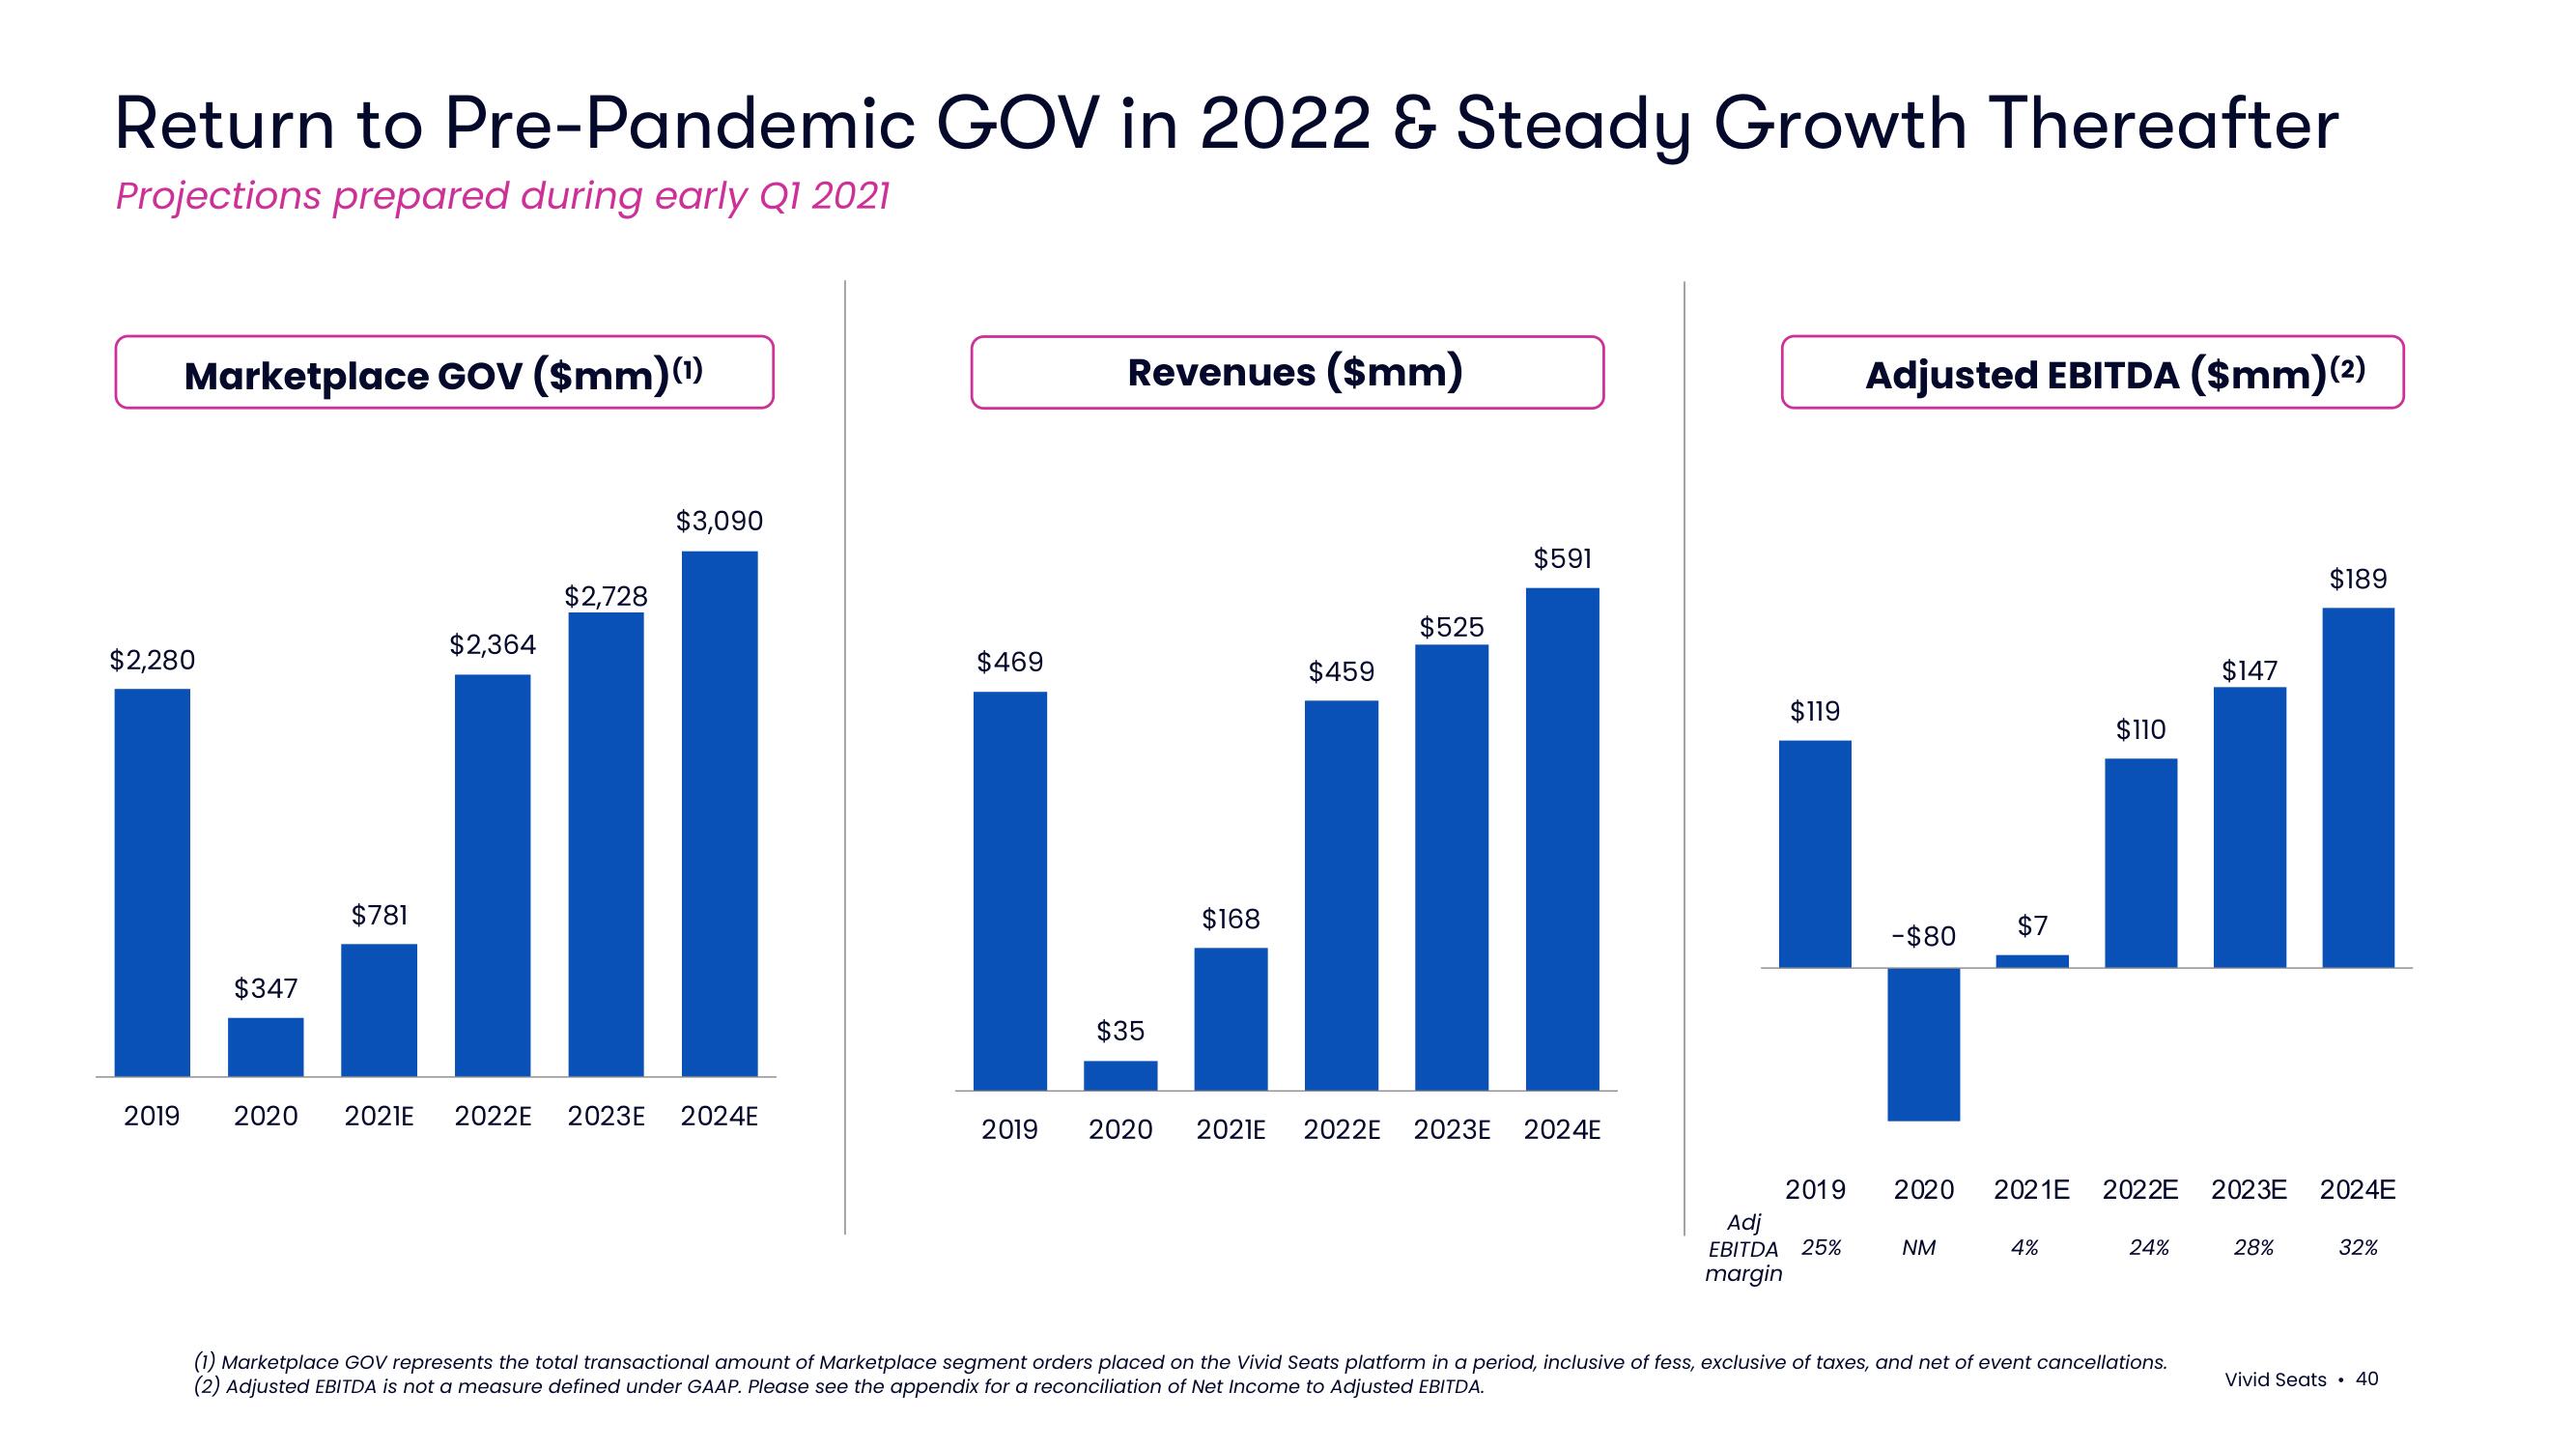
Return to Pre-Pandemic GOV in 2022 & Steady Growth Thereafter
Projections prepared during early Q1 2021
Marketplace GOV ($mm) (¹)
2019
$3,090
$2,728
$2,364
$2,280
Lill
$781
$347
2020 2021E 2022E 2023E 2024E
$469
Revenues ($mm)
$35
$168
$459
$525
$591
2019 2020 2021E 2022E 2023E 2024E
$119
2019
Adj
EBITDA 25%
margin
Adjusted EBITDA ($mm)(2)
-$80
2020
NM
$7
2021E
4%
$110
24%
$147
2022E 2023E 2024E
(1) Marketplace GOV represents the total transactional amount of Marketplace segment orders placed on the Vivid Seats platform in a period, inclusive of fess, exclusive of taxes, and net of event cancellations.
(2) Adjusted EBITDA is not a measure defined under GAAP. Please see the appendix for a reconciliation of Net Income to Adjusted EBITDA.
$189
28%
32%
Vivid Seats. 40View entire presentation