Ashtead Group Results Presentation Deck
23
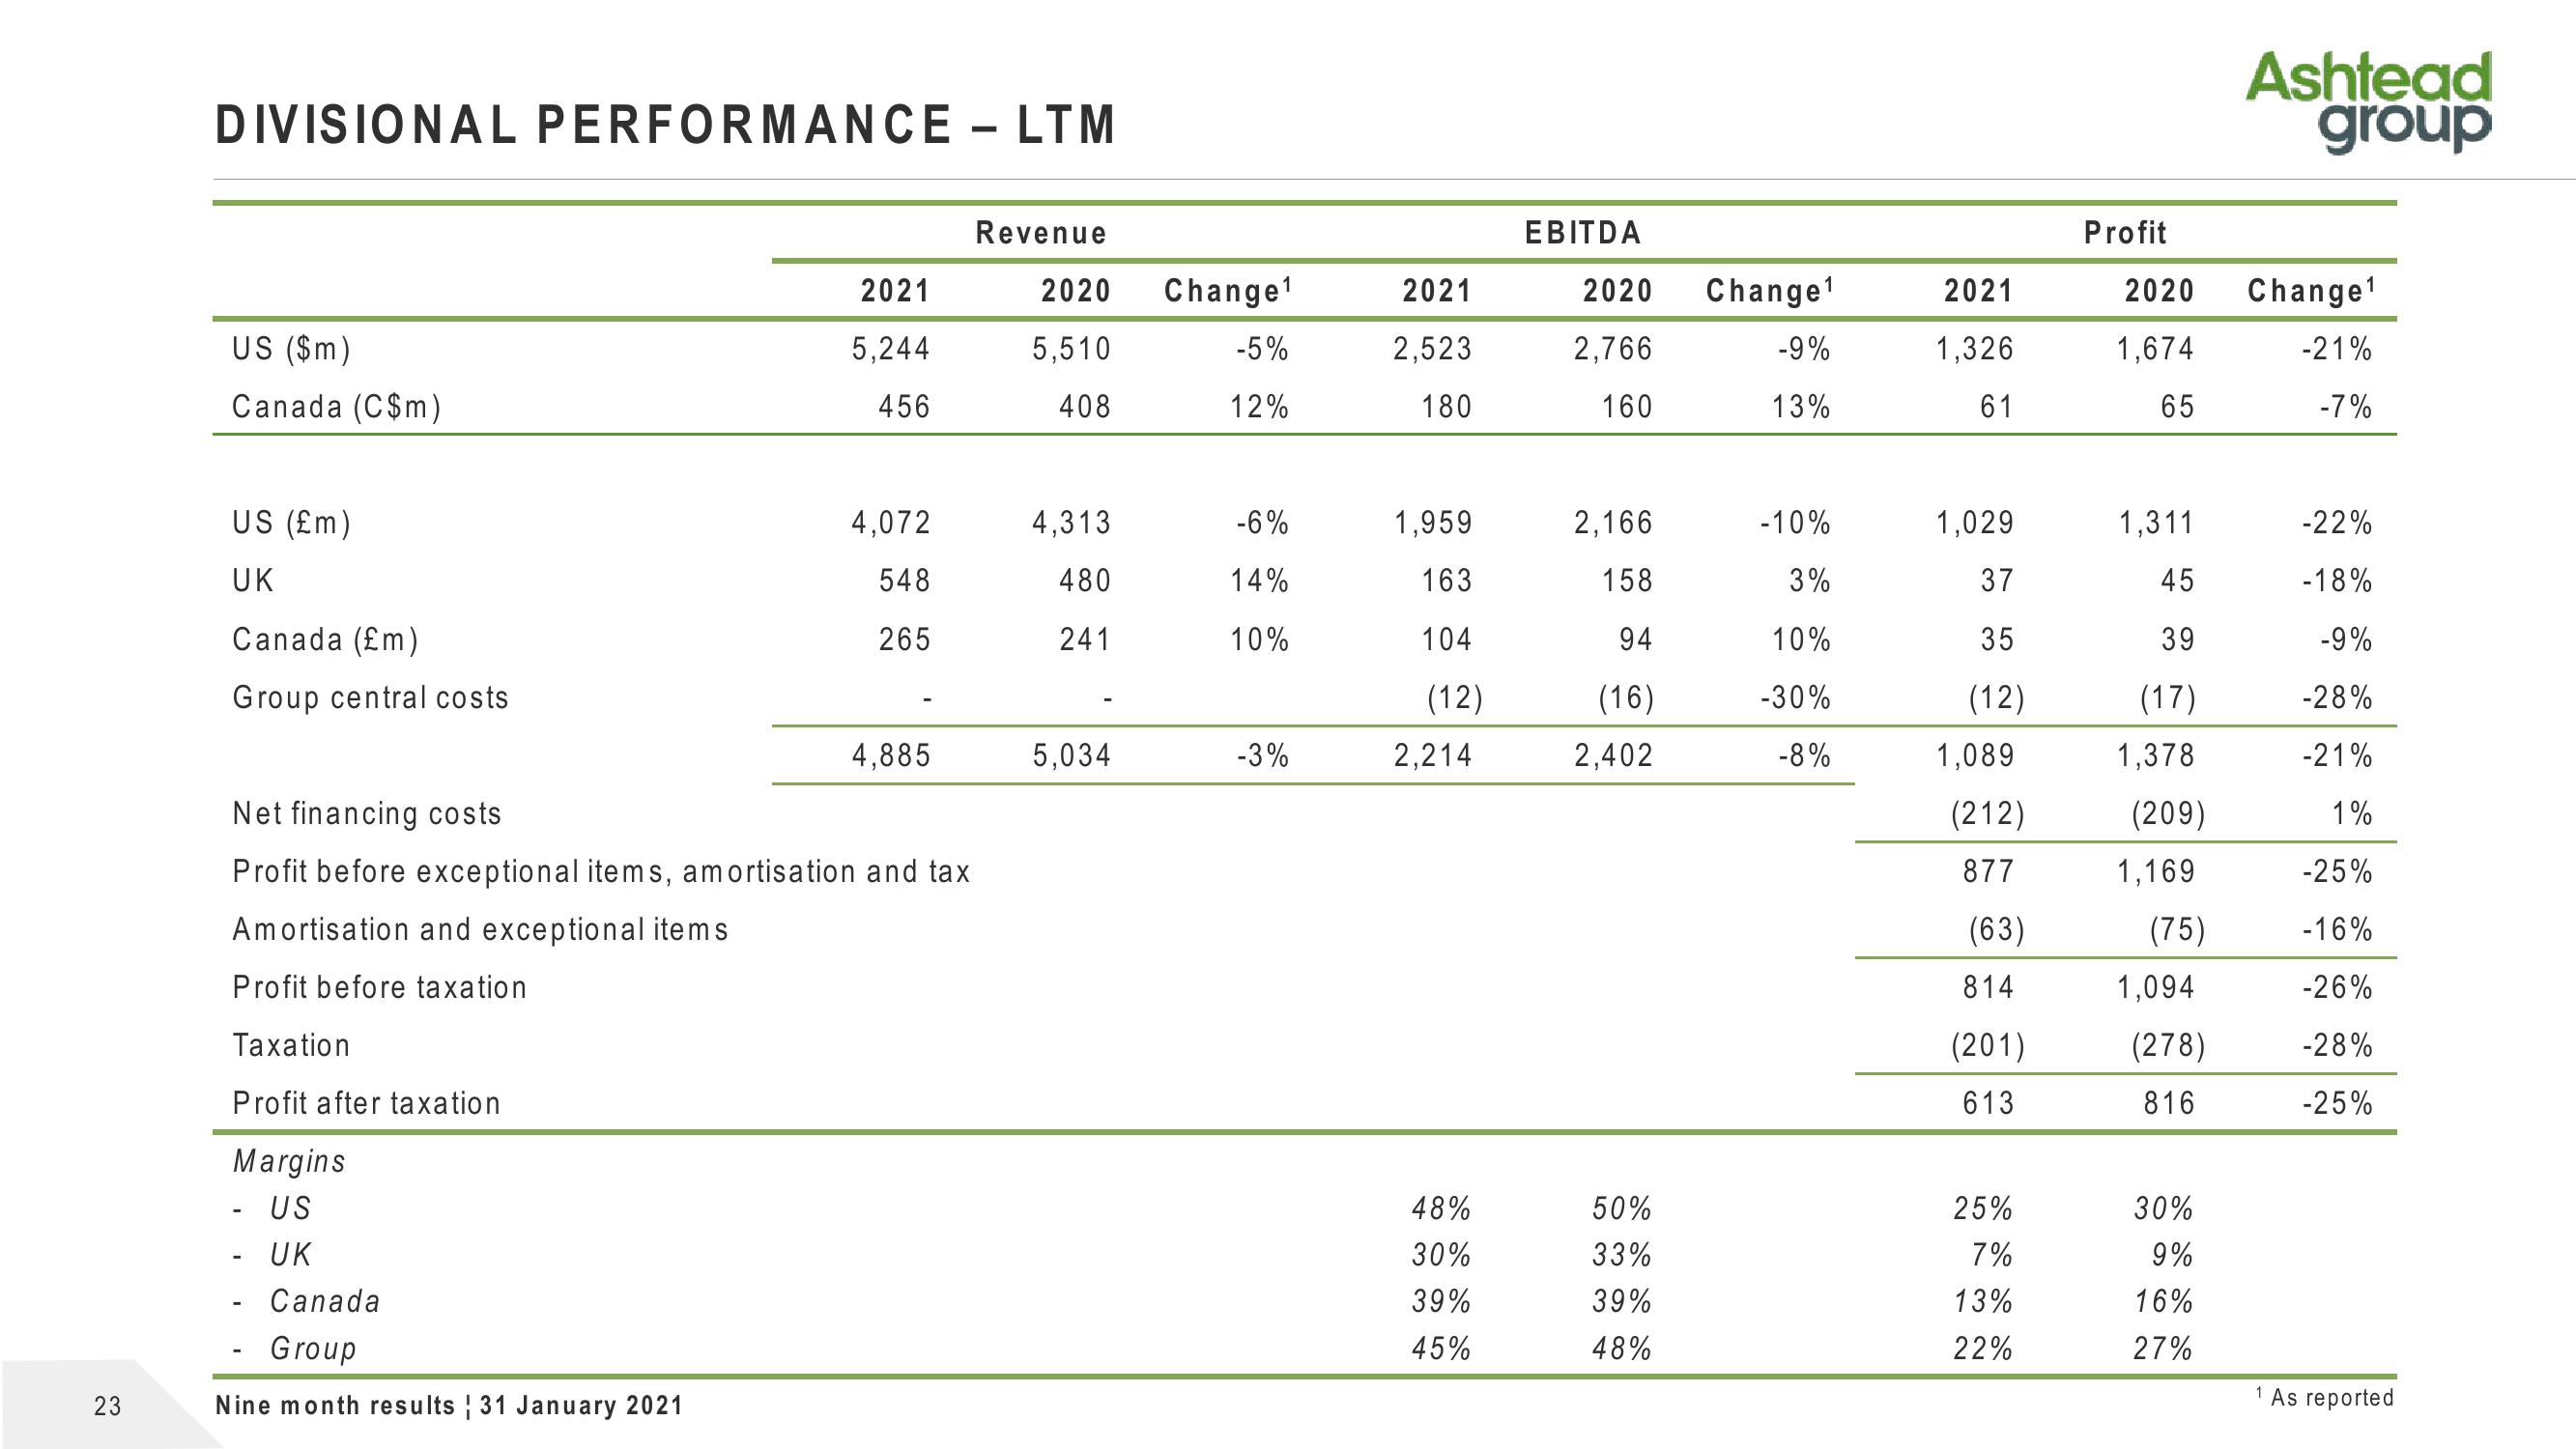
DIVISIONAL PERFORMANCE - LTM
US ($m)
Canada (C$m)
US (£m)
UK
Canada (£m)
Group central costs
Amortisation and exceptional items
Profit before taxation
Taxation
Profit after taxation
Margins
- US
- UK
Canada
2021
5,244
456
Net financing costs
Profit before exceptional items, amortisation and tax
- Group
Nine month results 31 January 2021
4,072
548
265
4,885
Revenue
5,510
2020 Change¹
-5%
12%
408
4,313
480
241
5,034
-6%
14%
10%
-3%
2021
2,523
180
1,959
163
104
(12)
2,214
48%
30%
39%
45%
EBITDA
2020 Change¹
2,766
160
2,166
158
94
(16)
2,402
50%
33%
39%
48%
-9%
13%
-10%
3%
10%
-30%
-8%
2021
1,326
61
1,029
37
35
(12)
1,089
(212)
877
(63)
814
(201)
613
25%
7%
13%
22%
Profit
2020 Change¹
1,674
-21%
65
-7%
1,311
45
39
(17)
1,378
(209)
1,169
(75)
1,094
(278)
816
Ashtead
group
30%
9%
16%
27%
1
-22%
-18%
-9%
-28%
-21%
1%
-25%
-16%
-26%
-28%
-25%
As reportedView entire presentation