Lyft Results Presentation Deck
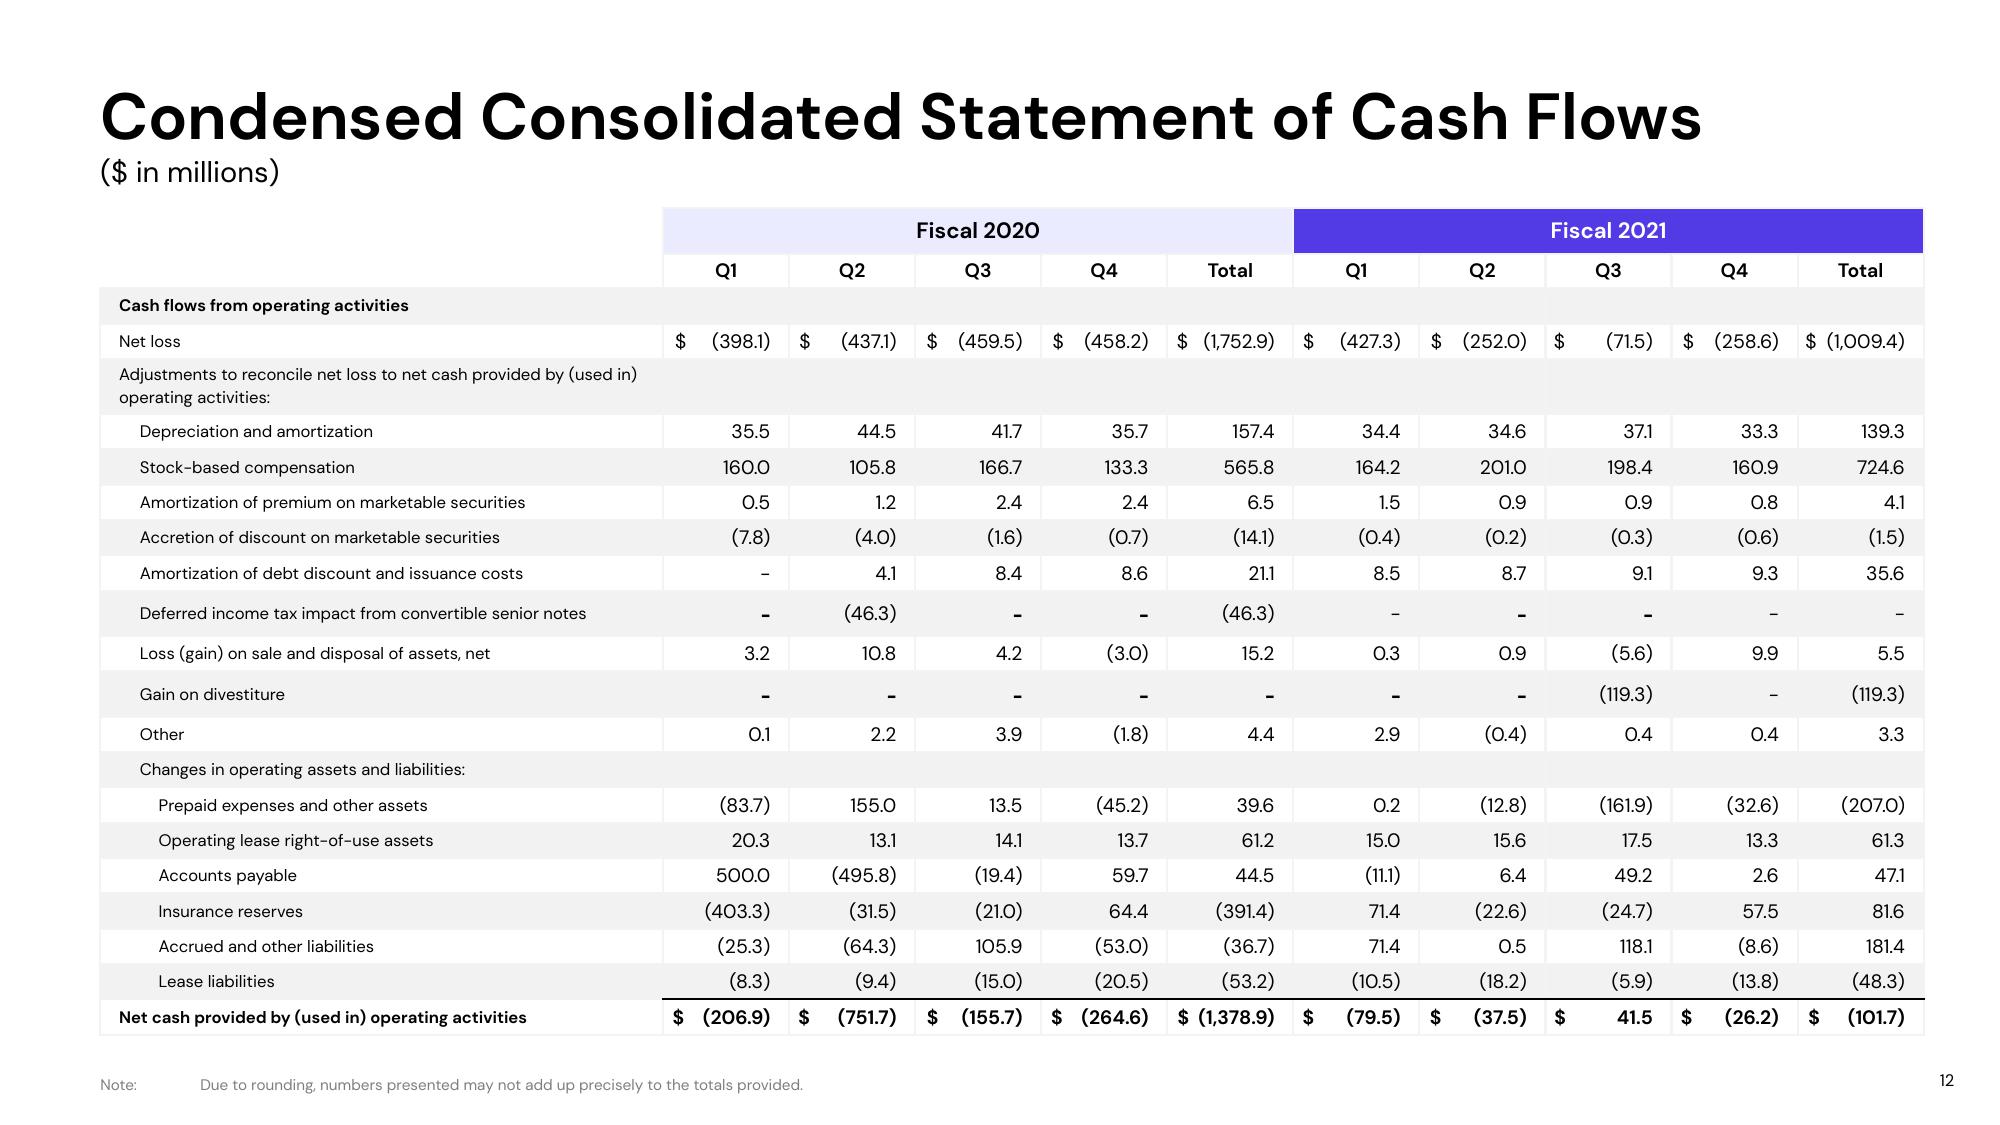
Condensed Consolidated Statement of Cash Flows
($ in millions)
Cash flows from operating activities
Net loss
Adjustments to reconcile net loss to net cash provided by (used in)
operating activities:
Depreciation and amortization
Stock-based compensation
Amortization of premium on marketable securities
Accretion of discount on marketable securities
Amortization of debt discount and issuance costs
Note:
Deferred income tax impact from convertible senior notes
Loss (gain) on sale and disposal of assets, net
Gain on divestiture
Other
Changes in operating assets and liabilities:
Prepaid expenses and other assets
Operating lease right-of-use assets
Accounts payable
Insurance reserves
Accrued and other liabilities
Lease liabilities
Net cash provided by (used in) operating activities
$
Q1
(398.1)
35.5
160.0
0.5
(7.8)
3.2
0.1
(83.7)
20.3
500.0
(403.3)
(25.3)
(8.3)
$ (206.9)
$
Q2
Due to rounding, numbers presented may not add up precisely to the totals provided.
$ (437.1) $ (459.5) $ (458.2)
44.5
105.8
1.2
(4.0)
4.1
(46.3)
10.8
2.2
Fiscal 2020
155.0
13.1
(495.8)
(31.5)
(64.3)
(9.4)
(751.7)
Q3
41.7
166.7
2.4
(1.6)
8.4
4.2
Q4
3.9
35.7
133.3
2.4
(0.7)
8.6
(3.0)
(1.8)
Total
$ (1,752.9)
157.4
565.8
6.5
(14.1)
21.1
(46.3)
15.2
4.4
13.5
(45.2)
14.1
13.7
(19.4)
59.7
(21.0)
64.4
105.9
(53.0)
(15.0)
(20.5)
$ (155.7) $ (264.6) $ (1,378.9) $
39.6
61.2
44.5
(391.4)
(36.7)
(53.2)
Q1
$ (427.3) $ (252.0)
34.4
164.2
1.5
(0.4)
8.5
0.3
2.9
Q2
0.2
15.0
(11.1)
71.4
71.4
(10.5)
(79.5) $
34.6
201.0
0.9
(0.2)
8.7
I
0.9
(0.4)
(12.8)
15.6
6.4
(22.6)
0.5
(18.2)
(37.5)
Fiscal 2021
$
$
Q3
(71.5)
37.1
198.4
0.9
(0.3)
9.1
I
(5.6)
(119.3)
0.4
(161.9)
17.5
49.2
(24.7)
118.1
(5.9)
41.5
Q4
$ (258.6)
33.3
160.9
0.8
(0.6)
9.3
9.9
0.4
Total
$ (1,009.4)
(32.6)
13.3
2.6
57.5
(8.6)
(13.8)
$ (26.2) $
139.3
724.6
4.1
(1.5)
35.6
5.5
33
(119.3)
3.3
(207.0)
61.3
47.1
81.6
181.4
(48.3)
(101.7)
12View entire presentation